

Question: Need help The graph shows the production function of an economy. Real GDP (trillions of 2009 dollars) 20 Currently, the full-employment quantity of labour is
Need help
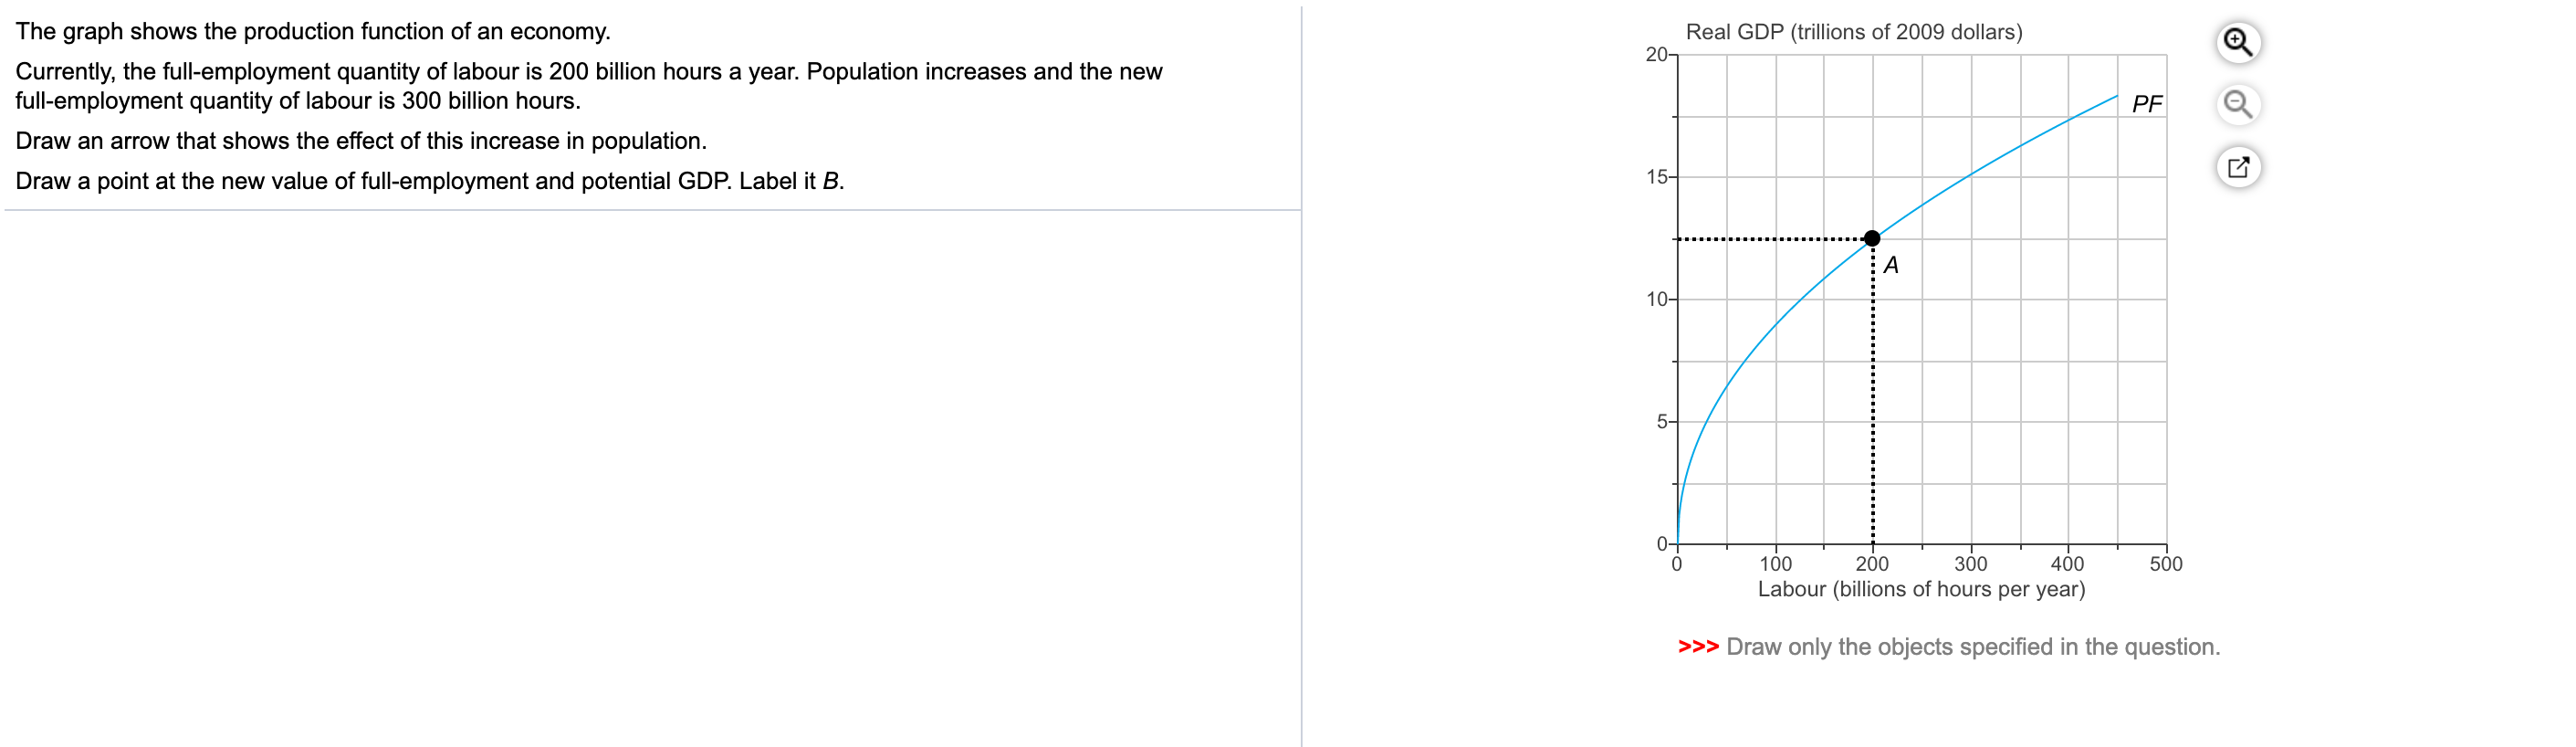
The graph shows the production function of an economy. Real GDP (trillions of 2009 dollars) 20 Currently, the full-employment quantity of labour is 200 billion hours a year. Population increases and the new full-employment quantity of labour is 300 billion hours. PF Draw an arrow that shows the effect of this increase in population. Draw a point at the new value of full-employment and potential GDP. Label it B. 1 ' / / 0 100 200 300 400 500 Labour (billions of hours per year) >>> Draw only the objects specied in the
Step by Step Solution
There are 3 Steps involved in it
1 Expert Approved Answer
Step: 1 Unlock

Question Has Been Solved by an Expert!
Get step-by-step solutions from verified subject matter experts
Step: 2 Unlock
Step: 3 Unlock