

Question: please help Real-Time Data Analysis Exercise* Inflation rate (percent per year) 9.0- *Real-time data provided by Federal Reserve Economic Data (FRED), Federal Reserve Bank of
please help
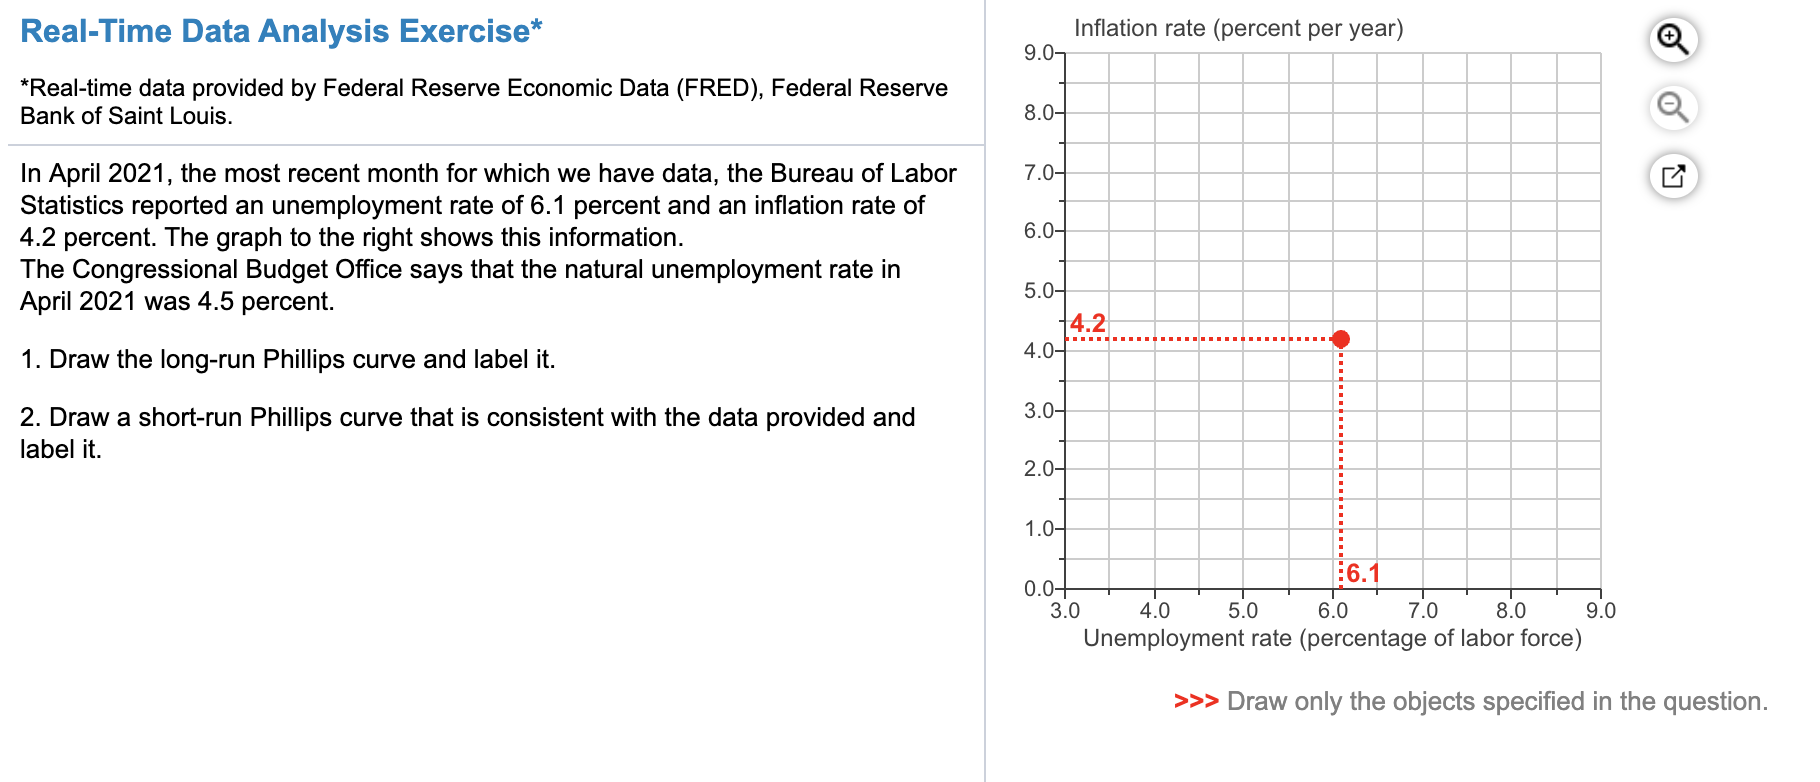
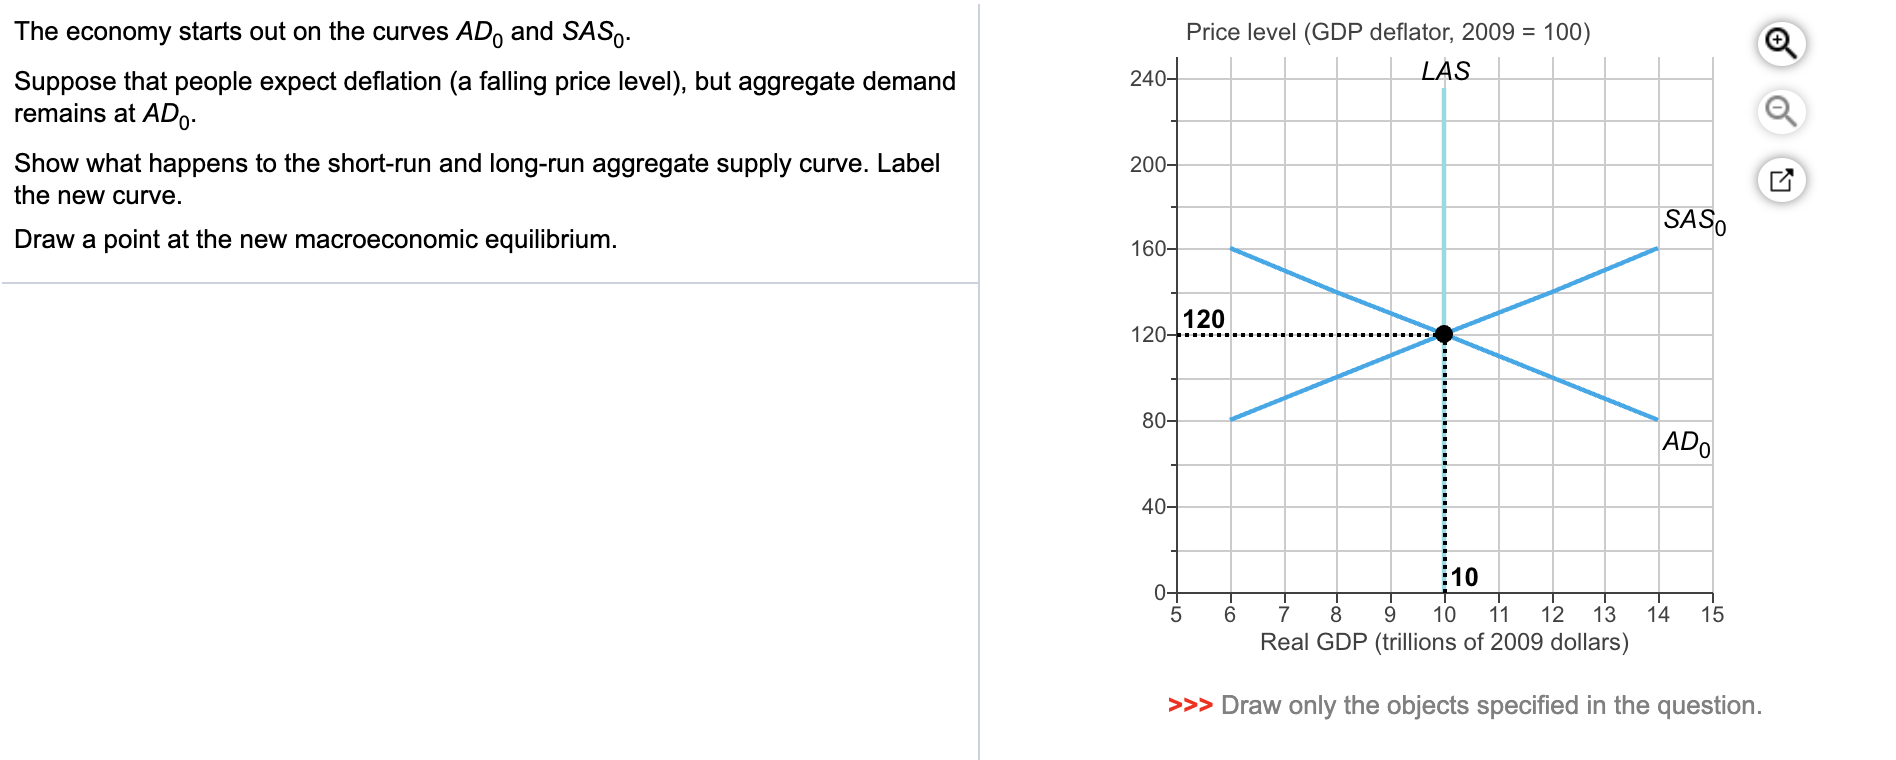
Real-Time Data Analysis Exercise* Inflation rate (percent per year) 9.0- *Real-time data provided by Federal Reserve Economic Data (FRED), Federal Reserve Bank of Saint Louis. 8.0- In April 2021, the most recent month for which we have data, the Bureau of Labor 7.0- Statistics reported an unemployment rate of 6.1 percent and an inflation rate of 4.2 percent. The graph to the right shows this information. 6.0- The Congressional Budget Office says that the natural unemployment rate in April 2021 was 4.5 percent. 5.0- 14.2 1. Draw the long-run Phillips curve and label it. 4.0- 2. Draw a short-run Phillips curve that is consistent with the data provided and 3.0- label it. 2.0 - 1.0- :6.1 0.0-+ 3.0 4.0 5.0 6.0 7.0 8.0 9.0 Unemployment rate (percentage of labor force) >>> Draw only the objects specified in the question.The economy starts out on the curves AD, and SAS. Price level (GDP deflator, 2009 = 100) + Suppose that people expect deflation (a falling price level), but aggregate demand 240- LAS remains at ADo- Show what happens to the short-run and long-run aggregate supply curve. Label 200- the new curve. SASo Draw a point at the new macroeconomic equilibrium. 160- 120 80- ADO 40- :10 6 7 8 9 10 11 12 13 14 15 Real GDP (trillions of 2009 dollars) >>> Draw only the objects specified in the
Step by Step Solution
There are 3 Steps involved in it

Get step-by-step solutions from verified subject matter experts