

Question: Need help to check my answer. Thanks. 17. Problem 17 The following graph shows the aggregate demand curve (AD), the short-run aggregate supply curve (AS),
Need help to check my answer. Thanks.
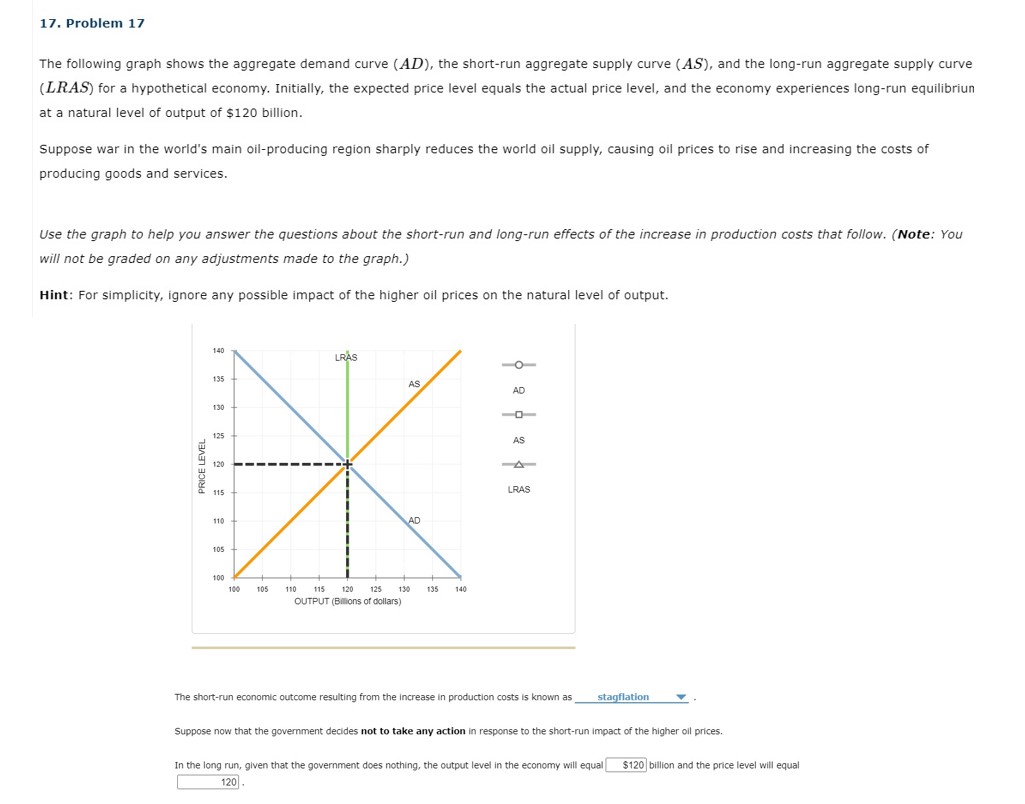
17. Problem 17 The following graph shows the aggregate demand curve (AD), the short-run aggregate supply curve (AS), and the long-run aggregate supply curve (LRAS) for a hypothetical economy. Initially, the expected price level equals the actual price level, and the economy experiences long-run equilibrium at a natural level of output of $120 billion. Suppose war in the world's main oil-producing region sharply reduces the world oil supply, causing oil prices to rise and increasing the costs of producing goods and services. Use the graph to help you answer the questions about the short-run and long-run effects of the increase in production costs that follow. (Note: You will not be graded on any adjustments made to the graph.) Hint: For simplicity, ignore any possible impact of the higher oil prices on the natural level of output. 140 LRAS 135 AS AD 130 -0- 125 AS 120 PRICE LEVEL A 115 LRAS 110 AD 105 100 180 105 110 115 120 125 130 135 140 OUTPUT (Billions of dollars) The short-run economic outcome resulting from the increase in production costs is known as_ stagflation Suppose now that the government decides not to take any action in response to the short-run impact of the higher oil prices. In the long run, given that the government does nothing, the output level in the economy will equal | $120 billion and the price level will equal 120
Step by Step Solution
There are 3 Steps involved in it

Get step-by-step solutions from verified subject matter experts