

Question: Need help understanding this problem and how to set it up. The percent of college students' marijuana use for a sample of 92,010 students is
Need help understanding this problem and how to set it up.
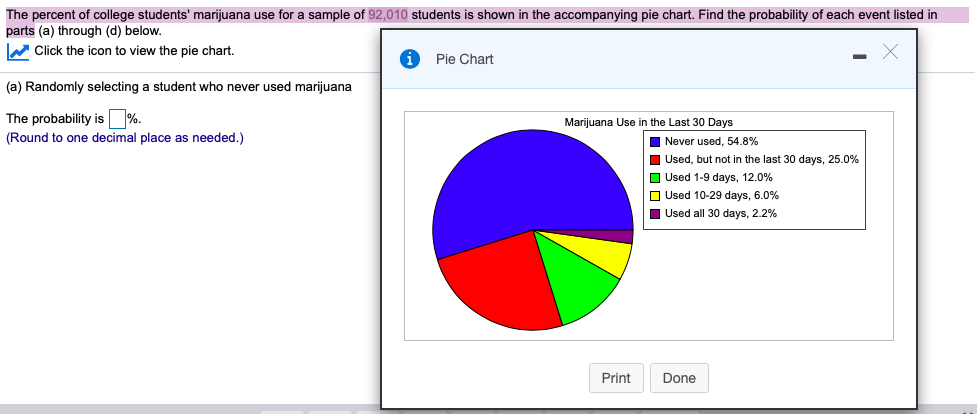
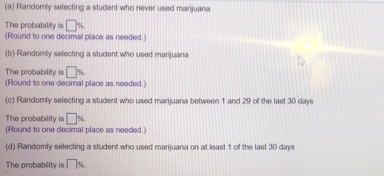
The percent of college students' marijuana use for a sample of 92,010 students is shown in the accompanying pie chart. Find the probability of each event listed in parts (a) through (d) below. Click the icon to view the pie chart. Pie Chart X (a) Randomly selecting a student who never used marijuana The probability is %. Marijuana Use in the Last 30 Days (Round to one decimal place as needed.) Never used, 54.8% Used, but not in the last 30 days, 25.0% Used 1-9 days, 12.0% Used 10-29 days, 6.0% Used all 30 days, 2.2% Print Done(aj Randomly solocling a ho movor time mainjunna The probability (Round to one decimal place as mcoded. ) (b) Randomly selecting a student who used mangusna The probability is (Round to one decimal place as mooded,) [e) Randomly selecting a student who used marijuana botwoon 1 and 20 of the last 30 days The probability is [Round to one decimal place as hooded.) (d) Randomly selecting a student who used marijuana on at least 1 of the last 30 days The probability
Step by Step Solution
There are 3 Steps involved in it

Get step-by-step solutions from verified subject matter experts