

Question: Test: Test 2.(Ch.3.2, Ch. 3.3, Ch. 3.4, ) Time Remaining: This Question: 1 pt 8 of 11 (8 complete) This The percent of college students'
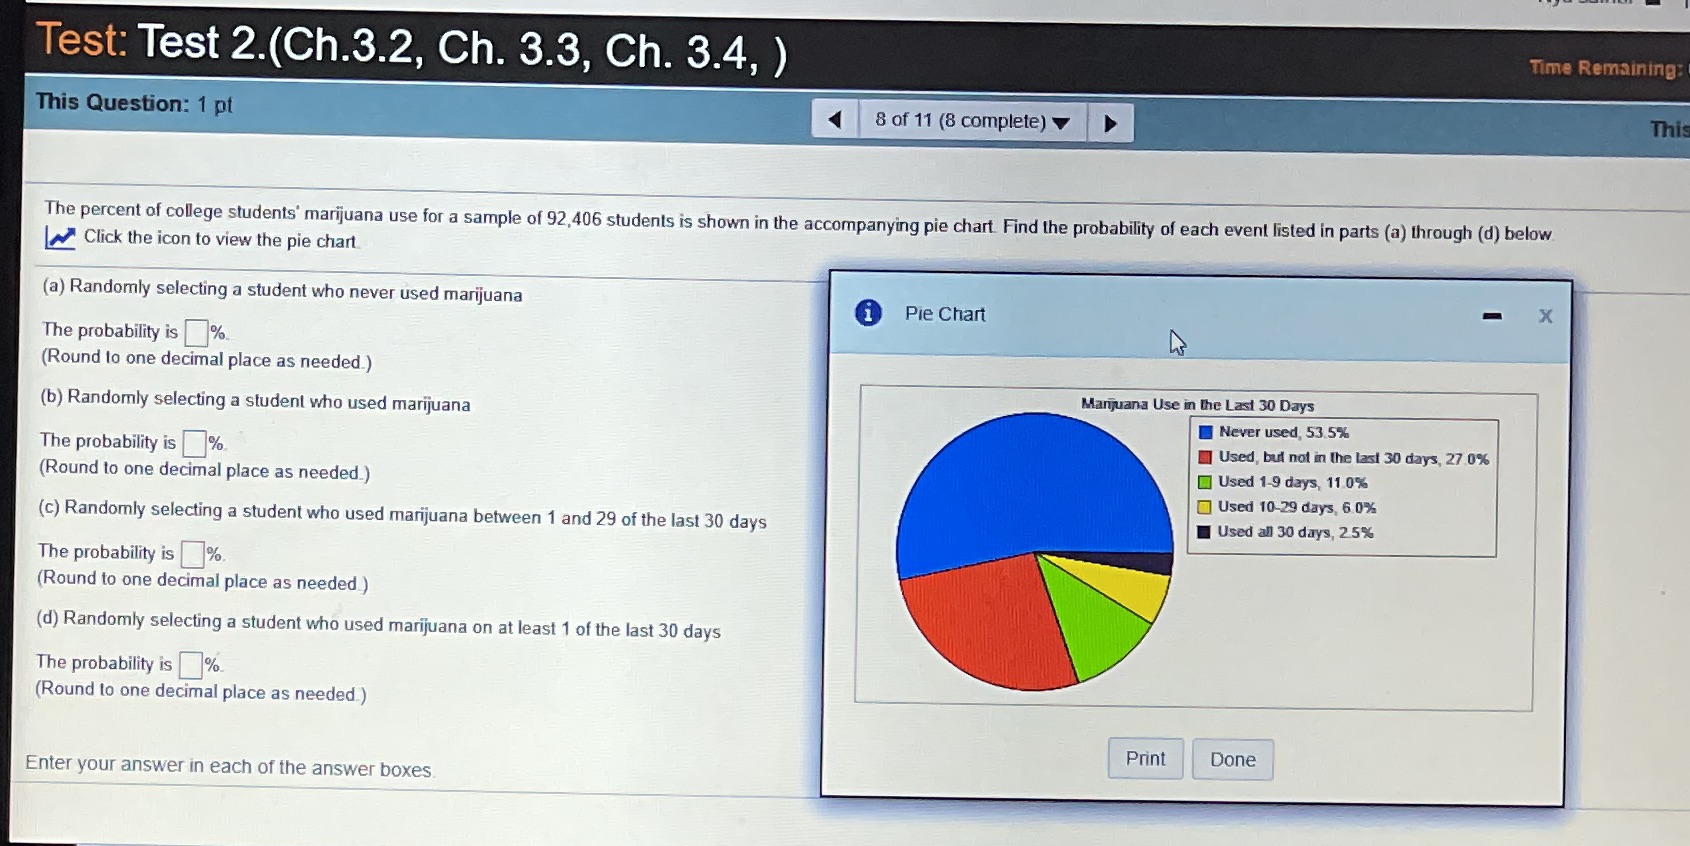
Test: Test 2.(Ch.3.2, Ch. 3.3, Ch. 3.4, ) Time Remaining: This Question: 1 pt 8 of 11 (8 complete) This The percent of college students' marijuana use for a sample of 92,406 students is shown in the accompanying pie chart. Find the probability of each event listed in parts (a) through (d) below Click the icon to view the pie chart (a) Randomly selecting a student who never used marijuana Pie Chart X The probability is% (Round to one decimal place as needed.) Marijuana Use in the Last 30 Days (b) Randomly selecting a student who used marijuana Never used, 53.5% The probability is% " Used, but not in the last 30 days, 27.0% (Round to one decimal place as needed.) Used 1-9 days, 11 0% Used 10-29 days, 6 0% (c) Randomly selecting a student who used marijuana between 1 and 29 of the last 30 days Used all 30 days, 25% The probability is% (Round to one decimal place as needed ) (d) Randomly selecting a student who used marijuana on at least 1 of the last 30 days The probability is% (Round to one decimal place as needed.) Print Done Enter your answer in each of the answer boxes
Step by Step Solution
There are 3 Steps involved in it

Get step-by-step solutions from verified subject matter experts