

Question: need help w vertical analysis please (first pic) 2nd pic is additional info M D F G H K L Instructions: 1) Only enter answers
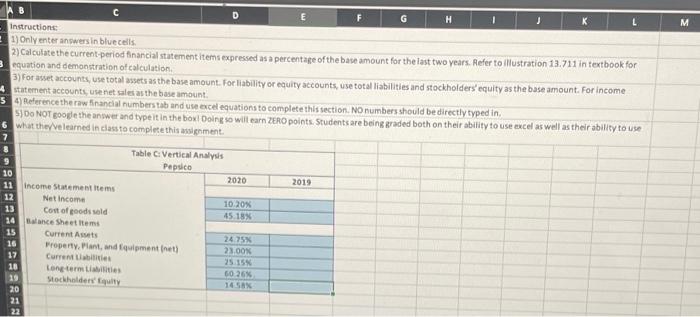
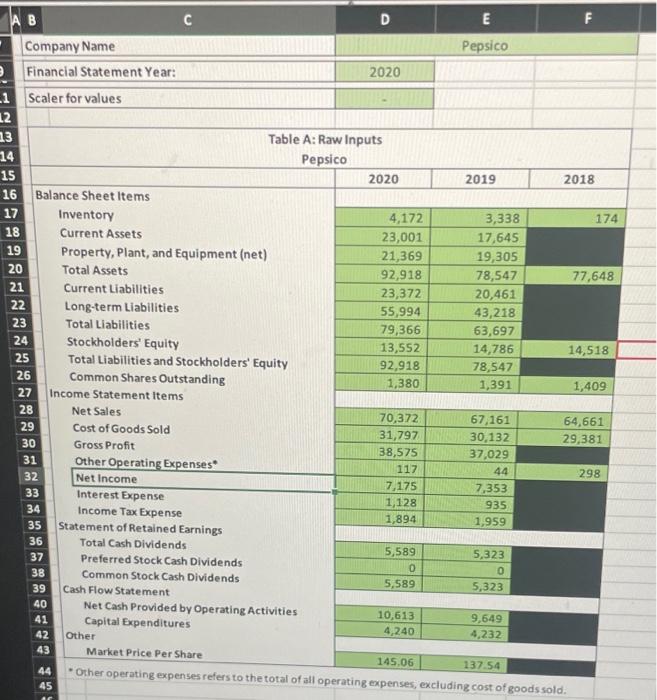
M D F G H K L Instructions: 1) Only enter answers in blue cells. 2) Calculate the current period financial statement items expressed as a percentage of the base amount for the last two years. Refer to illustration 13.711 in textbook for 3 equation and demonstration of calculation 5) for asset accounts, use total assets as the base amount. For liability or equity accounts, vse total liabilities and stockholders' equity as the base amount. For income 4 statement accounts, use net sales as the best amount 54 Reference the raw financial numbers tab and use excel equations to complete this section. NO numbers should be directly typed in SJDO NOT google the answer and type it in the box Doing so will earn ZERO points. Students are being graded both on their ability to use excel as well as their ability to use 6 what they ve learned in class to complete this assignment Table C Vertical Analysis Pepsico 10 2020 2019 11 Income Statement items 12 Net Income 10,20% 13 Cost of goods sold 45.18% 24 lance SheetItems 15 Current Assets 24.75% 16 Property. Plant, and Equipment inet) 23.00 17 Currenties 25.15 18 Long termes 60 26% 19 Stockholders' Equity 1458 20 21 22 AB D E F Company Name Pepsico Financial Statement Year: 2020 1 Scaler for values 12 13 Table A: Raw Inputs 14 Pepsico 15 2020 2019 2018 16 Balance Sheet Items 17 Inventory 4,172 3,338 174 18 Current Assets 23,001 17,645 19 Property, Plant, and Equipment (net) 21,369 19,305 20 Total Assets 92,918 78,547 77,648 21 Current Liabilities 23,372 20,461 22 Long-term Liabilities 55,994 43,218 23 Total Liabilities 79,366 63,697 24 Stockholders' Equity 13,552 14,786 14,518 25 Total Liabilities and Stockholders' Equity 92,918 78,547 26 Common Shares Outstanding 1,380 1,391 1,409 27 Income Statement Items 28 Net Sales 70,372 67,161 64,661 29 Cost of Goods Sold 31,79730,132 29,381 30 Gross Profit 38,575 37,029 31 Other Operating Expenses 117 44 298 32 Net Income 7,175 7,353 33 Interest Expense 1,128 935 34 Income Tax Expense 1,894 1,959 35 Statement of Retained Earnings 36 Total Cash Dividends 5,589 37 Preferred Stock Cash Dividends 5,323 0 0 38 Common Stock Cash Dividends 5,589 39 Cash Flow Statement 5,323 40 Net Cash Provided by Operating Activities 10,613 41 9,649 Capital Expenditures 4,240 42 Other 4,232 Market Price Per Share 145.06 137.54 44 Other operating expenses refers to the total of all operating expenses, excluding cost of goods sold. 45 43
Step by Step Solution
There are 3 Steps involved in it

Get step-by-step solutions from verified subject matter experts