

Question: need help with 2 please this too Data Table Complete the table below based on Data Table 5: Determination of Sugar in a Beverage from
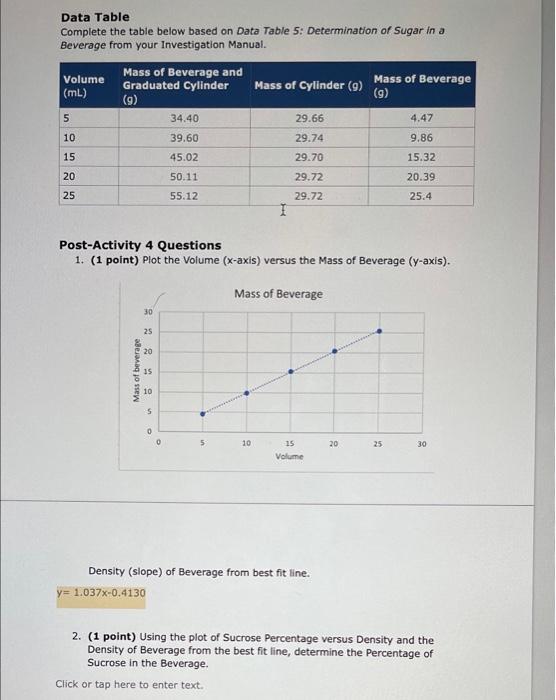
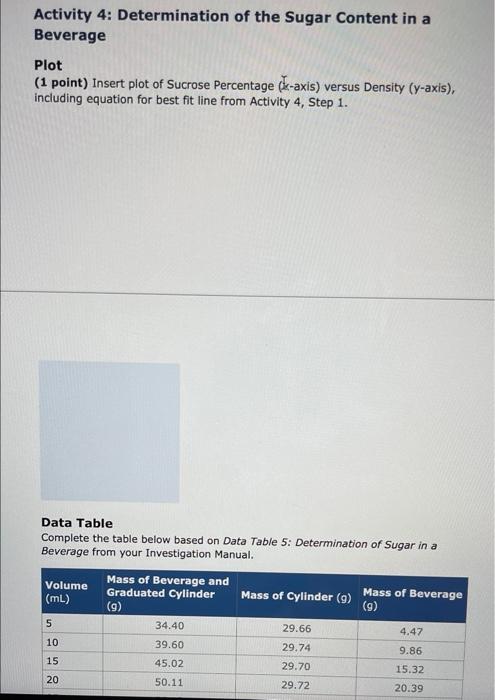
Data Table Complete the table below based on Data Table 5: Determination of Sugar in a Beverage from your Investigation Manual. Mass of Beverage and Volume Graduated Cylinder Mass of Cylinder (9) Mass of Beverage (mL) (9) (9) 5 34.40 29.66 4.47 10 39.60 29.74 9.86 15 45.02 15.32 20 50.11 29.70 29.72 29.72 20.39 25 55.12 25.4 1 Post-Activity 4 Questions 1. (1 point) Plot the Volume (x-axis) versus the Mass of Beverage (y-axis). Mass of Beverage 30 25 20 Mass of beverage 15 10 5 0 5 10 20 25 30 15 Volume Density (slope) of Beverage from best fit line. y= 1.037x-0.4130 2. (1 point) Using the plot of Sucrose Percentage versus Density and the Density of Beverage from the best fit line, determine the Percentage of Sucrose in the Beverage. Click or tap here to enter text. Activity 4: Determination of the Sugar Content in a Beverage Plot (1 point) Insert plot of Sucrose Percentage (L-axis) versus Density (y-axis), including equation for best fit line from Activity 4, Step 1. Data Table Complete the table below based on Data Table 5: Determination of Sugar in a Beverage from your Investigation Manual. Mass of Beverage and Volume Graduated Cylinder Mass of Cylinder (9) Mass of Beverage (ml) (9) (9) 5 34.40 29.66 4.47 10 39.60 29.74 9.86 15 45.02 29.70 15.32 20 50.11 29.72 20.39 8 Data Table Complete the table below based on Data Table 5: Determination of Sugar in a Beverage from your Investigation Manual. Mass of Beverage and Volume Graduated Cylinder Mass of Cylinder (9) Mass of Beverage (mL) (9) (9) 5 34.40 29.66 4.47 10 39.60 29.74 9.86 15 45.02 15.32 20 50.11 29.70 29.72 29.72 20.39 25 55.12 25.4 1 Post-Activity 4 Questions 1. (1 point) Plot the Volume (x-axis) versus the Mass of Beverage (y-axis). Mass of Beverage 30 25 20 Mass of beverage 15 10 5 0 5 10 20 25 30 15 Volume Density (slope) of Beverage from best fit line. y= 1.037x-0.4130 2. (1 point) Using the plot of Sucrose Percentage versus Density and the Density of Beverage from the best fit line, determine the Percentage of Sucrose in the Beverage. Click or tap here to enter text. Activity 4: Determination of the Sugar Content in a Beverage Plot (1 point) Insert plot of Sucrose Percentage (L-axis) versus Density (y-axis), including equation for best fit line from Activity 4, Step 1. Data Table Complete the table below based on Data Table 5: Determination of Sugar in a Beverage from your Investigation Manual. Mass of Beverage and Volume Graduated Cylinder Mass of Cylinder (9) Mass of Beverage (ml) (9) (9) 5 34.40 29.66 4.47 10 39.60 29.74 9.86 15 45.02 29.70 15.32 20 50.11 29.72 20.39 8
Step by Step Solution
There are 3 Steps involved in it

Get step-by-step solutions from verified subject matter experts