

Question: Need help with 6 and 7, setting up the chart. if i could see the sample of the chart and how to set it all
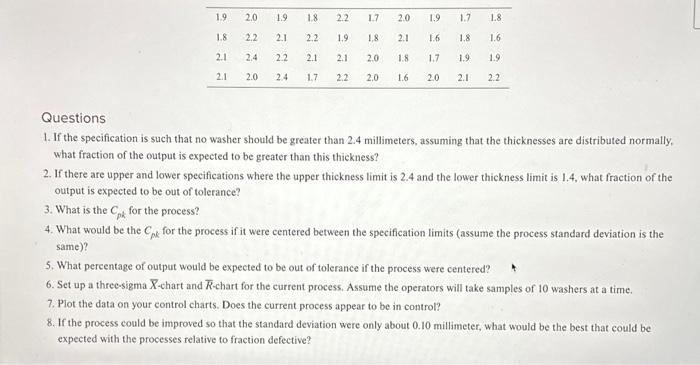
Questions 1. If the specification is such that no washer should be greater than 2.4 millimeters, assuming that the thicknesses are distributed normally, what fraction of the output is expected to be greater than this thickness? 2. If there are upper and lower specifications where the upper thickness limit is 2.4 and the lower thickness limit is 1.4 , what fraction of the output is expected to be out of tolerance? 3. What is the Cpk for the process? 4. What would be the Ck for the process if it were centered between the specification limits (assume the process standard deviation is the same)? 5. What pereentage of output would be expected to be out of tolerance if the process were centered? 6. Set up a three-sigma X-chart and R-chart for the current process. Assume the operators will take samples of 10 washers at a time. 7. Plot the data on your control charts. Does the current process appear to be in control? 8. If the process could be improved so that the standard deviation were only about 0.10 millimeter, what would be the best that could be expected with the processes relative to fraction defective
Step by Step Solution
There are 3 Steps involved in it

Get step-by-step solutions from verified subject matter experts