

Question: need help with a MATLAB question 4. Create x and y vectors to represent the following data. 10 20 30 40 50 60 70 80
need help with a MATLAB question
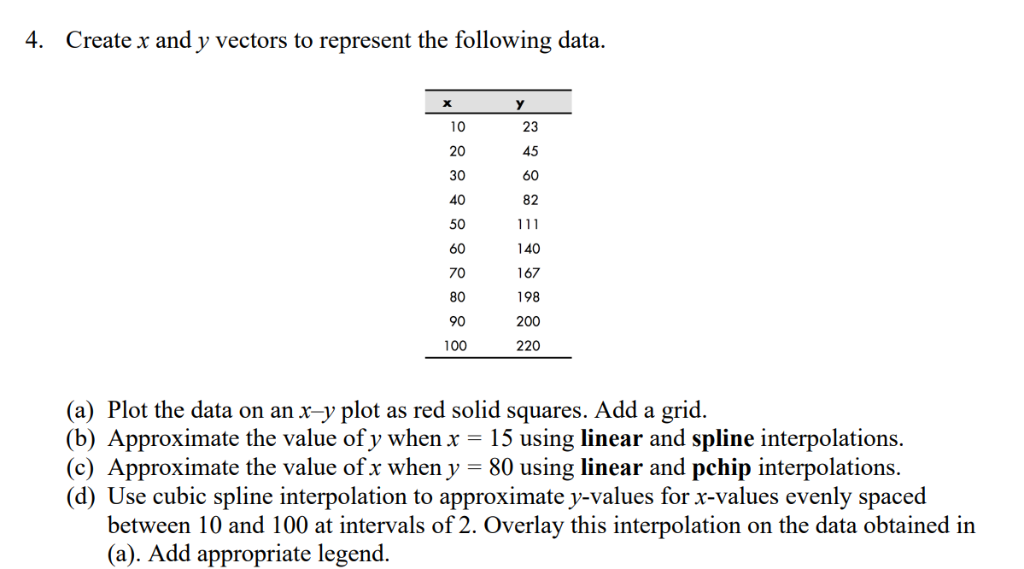
4. Create x and y vectors to represent the following data. 10 20 30 40 50 60 70 80 90 100 23 60 82 140 167 198 200 220 (a) Plot the data on an x-y plot as red solid squares. Add a grid (b) Approximate the value ofy when x - 15 using linear and spline interpolations. (c) Approximate the value of x when y -80 using linear and pchip interpolations (d) Use cubic spline interpolation to approximate y-values for x-values evenly spaced between 10 and 100 at intervals of 2. Overlay this interpolation on the data obtained in (a). Add appropriate legend
Step by Step Solution
There are 3 Steps involved in it
1 Expert Approved Answer
Step: 1 Unlock

Question Has Been Solved by an Expert!
Get step-by-step solutions from verified subject matter experts
Step: 2 Unlock
Step: 3 Unlock