

Question: Need help with creating graphs with python Q1) Create a histogram of the following data. Copy/Past the histogram below and summarize your observations about the
Need help with creating graphs with python 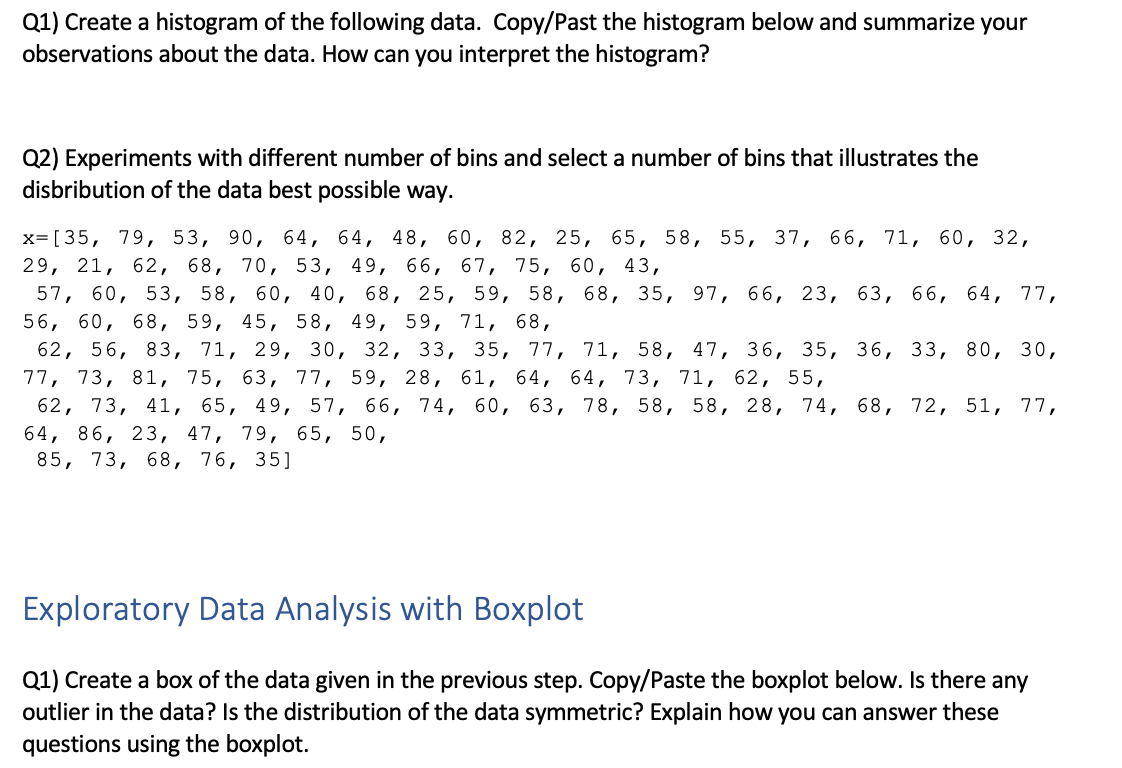
Q1) Create a histogram of the following data. Copy/Past the histogram below and summarize your observations about the data. How can you interpret the histogram? Q2) Experiments with different number of bins and select a number of bins that illustrates the disbribution of the data best possible way. x= [35, 79, 53, 90, 64, 64, 48, 60, 82, 25, 65, 58, 55, 37, 66, 71, 60, 32, 29, 21, 62, 68, 70, 53, 49, 66, 67, 75, 60, 43, 57, 60, 53, 58, 60, 40, 68, 25, 59, 58, 68, 35, 97, 66, 23, 63, 66, 64, 77, 56, 60, 68, 59, 45, 58, 49, 59, 71, 68, 62, 56, 83, 71, 29, 30, 32, 33, 35, 77, 71, 58, 47, 36, 35, 36, 33, 80, 30, 77, 73, 81, 75, 63, 77, 59, 28, 61, 64, 64, 73, 71, 62, 55, 62, 73, 41, 65, 49, 57, 66, 74, 60, 63, 78, 58, 58, 28, 74, 68, 72, 51, 77, 64, 86, 23, 47, 79, 65, 50, 85, 73, 68, 76, 35] Exploratory Data Analysis with Boxplot Q1) Create a box of the data given in the previous step. Copy/Paste the boxplot below. Is there any outlier in the data? Is the distribution of the data symmetric? Explain how you can answer these questions using the boxplot
Step by Step Solution
There are 3 Steps involved in it

Get step-by-step solutions from verified subject matter experts