

Question: need help with explanation for filling out this chart please and thank you. Problem set 3: Use the following data to answer questions 11-15 (20
need help with explanation for filling out this chart please and thank you.
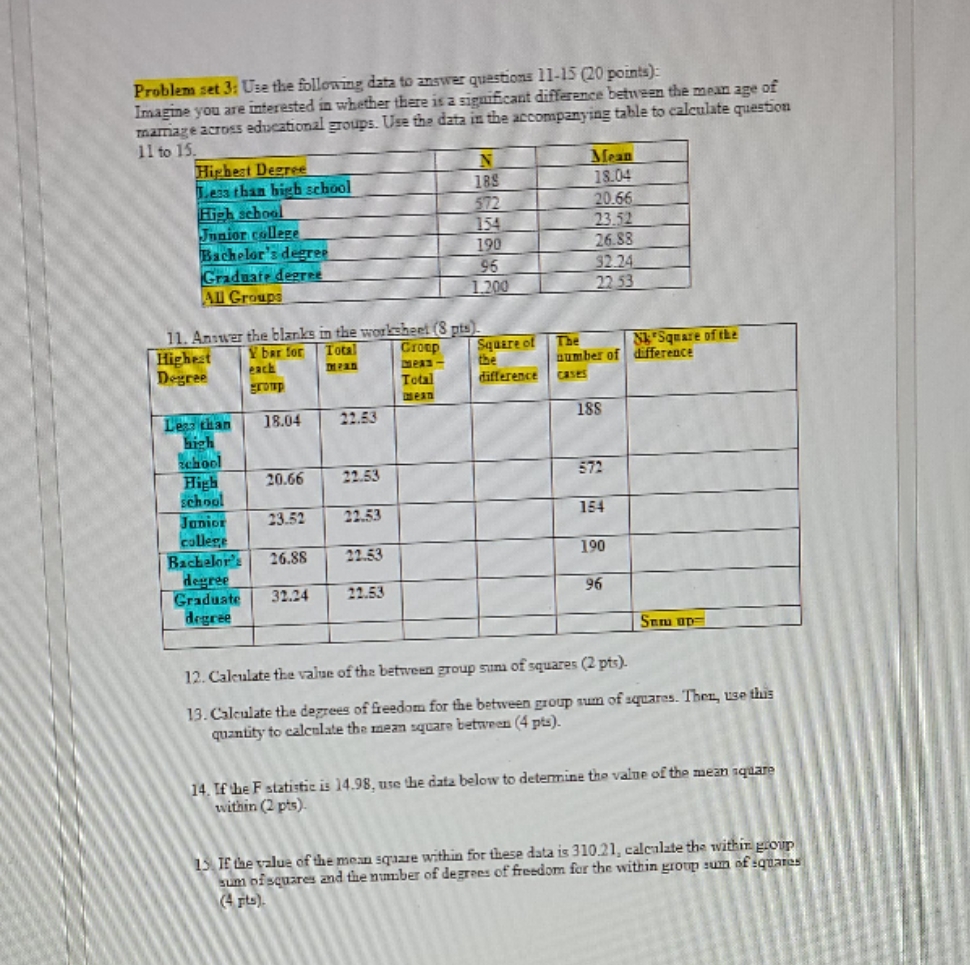
Problem set 3: Use the following data to answer questions 11-15 (20 points): Imagine you are interested in whether there is a significant difference between the mean age of marriage across educational groups. Use the data in the accompanying table to calculate question 11 to 15. Highest Degree N Mean Less than high school 189 18.04 High school 572 20.66 Junior college 154 23.52 Bachelor's degree 190 26.88 Graduate degree 96 32.24 All Groups 1.200 22 53 11. Answer the blanks in the worksheet (8 pts). Highest Y bar for Total Group Square of The N Square of the Degree each the number of difference Total difference CASES mean Less than 18.04 22.53 188 high school High 20.66 22.53 572 school Junior 23.52 22.53 154 college Bachelor's 26.88 22.53 190 degree Graduate 32.24 22.53 96 degree Som OD 12. Calculate the value of the between group sum of squares (2 pts). 13. Calculate the degrees of freedom for the between group sum of squares. Then, use this quantity to calculate the mean square between (4 pt). 14. If the F statistic is 14.98, use the data below to determine the value of the mean square within (2 pts) If the value of the mean square within for these data is 310.21, calculate the within group sum of squares and the number of degrees of freedom for the within group sum of equares (4 pts)
Step by Step Solution
There are 3 Steps involved in it

Get step-by-step solutions from verified subject matter experts