

Question: Part 5 : Really need help, please show work Problem set 4: use the following information to answer questions 11-15 (15 points total): Let's examine
Part 5 : Really need help, please show work
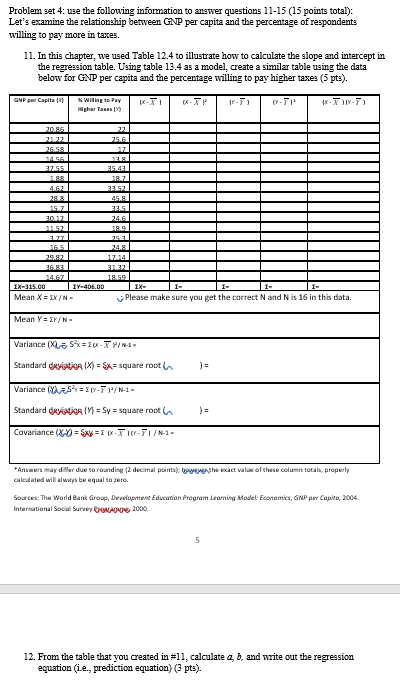
Problem set 4: use the following information to answer questions 11-15 (15 points total): Let's examine the relationship between GNP per capita and the percentage of respondents willing to pay more in taxes. 11. In this chapter, we used Table 12.4 to illustrate how to calculate the slope and intercept in the regression table. Using table 13.4 as a model, create a similar table using the data below for GNP per capita and the percentage willing to pay higher taxes (5 pt:). " Wiling to Pay cr- FP Whar Takes 150 27 11.23 25.6 16.53 17 17.55 35.43 1.83 18.7 4.67 45.3 3315 10. 17 24.6 74.8. 1714 IX-315 00 IY-406.00 1X- 1- 1- 1- 1- Mean X = EX /N - Please make sure you get the correct N and N is 16 in this data. Mean Y = 27/ N = Variance (05 5x = Exx - X P/N.I. Standard deviation (X) = 8%= square root Variance (-S = 10-71/1- Standard deviation (1) = Sy = square root ( IE Covariance (XO = =1 Rx X 10-71 /1- Answers may d "or due to rounding (2 decimal pointsk baggagethe exact value of these column totals, properly cakedated will always be equal to mere. Source: The World Bank Group, Devlopment Education Program Learning Model Economics, GMP per Copko, 2004. International Social Survery C-gagagigg, 2000. 5 12. From the table that you created in #11, calculate a b, and write out the regression equation (i.e., prediction equation) (3 pts)
Step by Step Solution
There are 3 Steps involved in it

Get step-by-step solutions from verified subject matter experts