

Question: Need help with getting the right answer 2. [ True / False ] The graph below shows the indifference curves for investor A and B.
Need help with getting the right answer
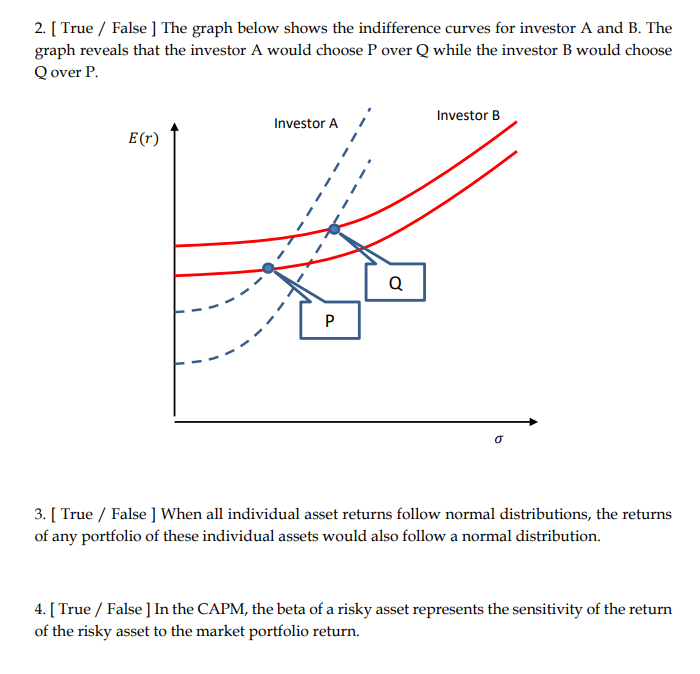
2. [ True / False ] The graph below shows the indifference curves for investor A and B. The graph reveals that the investor A would choose P over Q while the investor B would choose Q over P. Investor A Investor B E(r) Q P 3. [ True / False ] When all individual asset returns follow normal distributions, the returns of any portfolio of these individual assets would also follow a normal distribution. 4. [ True / False ] In the CAPM, the beta of a risky asset represents the sensitivity of the return of the risky asset to the market portfolio return
Step by Step Solution
There are 3 Steps involved in it
1 Expert Approved Answer
Step: 1 Unlock

Question Has Been Solved by an Expert!
Get step-by-step solutions from verified subject matter experts
Step: 2 Unlock
Step: 3 Unlock