

Question: Need help with maths and formulas / answers using the attached info please: 1 - WACC 2 - Cost of Capital many thanks ! Sunrise
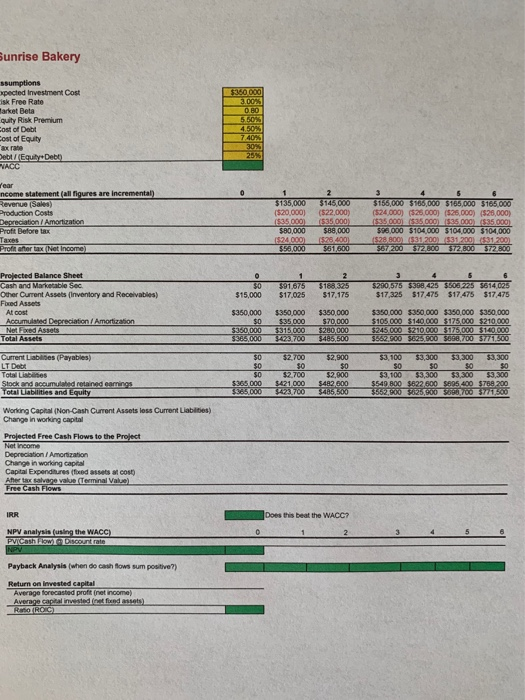
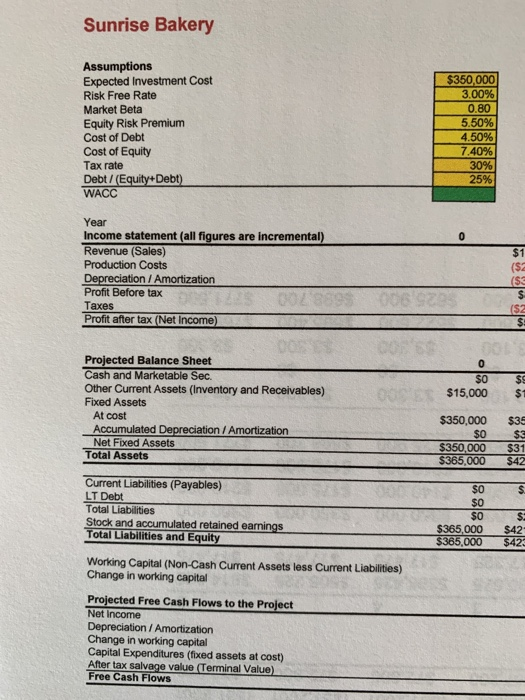
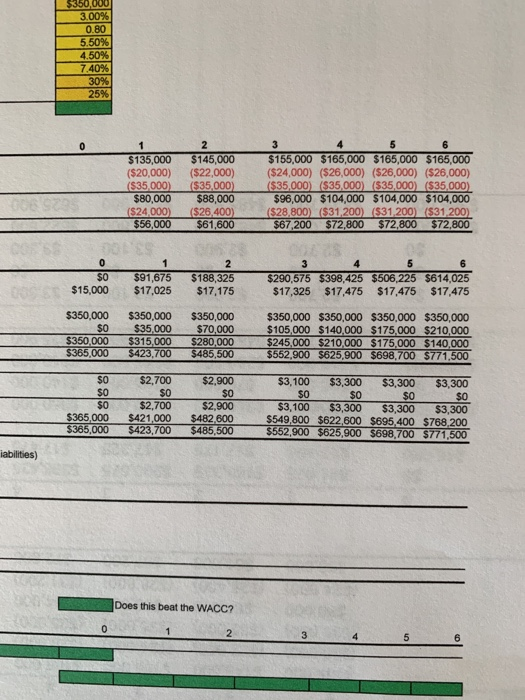
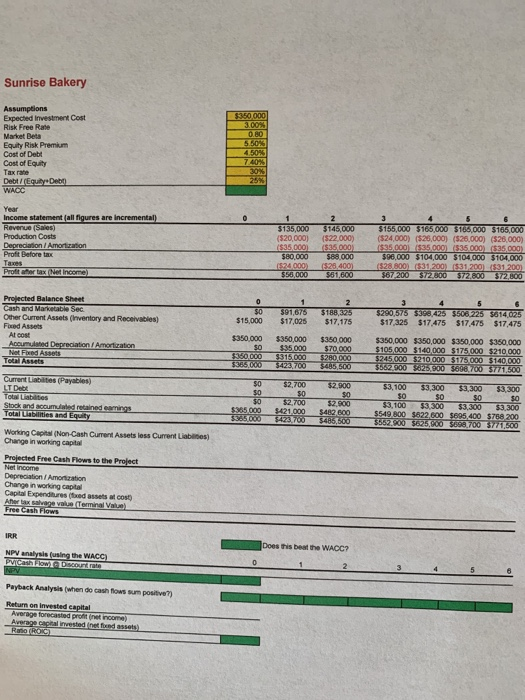
Sunrise Bakery sumptions xpected Investment Cost isk Free Rate Tarket Beta quity Risk Premium cost of Debt Cost of Equity ex rate Debt/Equity Debo VACC SLOOOO 3.00% 5.50% 250% 7.40 30% Year income statement (all figures are incremental) Revenue (Sales) Production Costs Depreciation / Amortization Profit Before tax Taxes Profit arter tax (Net Income) 1 $135,000 (520,000) $35 000 $80,000 $24.000 $56,000 2 3145.000 (522,000) (535.000 $88,000 (548.400 $61,600 3 6 $156,000 $100,000 $765,000 $165.000 (524,000) (525.000) (525.000) (526,000) $35.000 (335.000.000 $35.000) 596,000 $104.000 5104.000 $104,000 5:28.800531200831200831200 567/200 $12.800 $72.800 5727800 30 $15,000 1 $91.675 $17.025 2 $168325 $17,175 3 5 6 $290,575 $398,425 $506 225 5614,025 $17,325 $17.475 $17.475 $17,475 Projected Balance Sheet Cash and Marketable Sec Other Current Assets (Inventory and Receivable) Fixed Assets Al cost Accumulated Depreciation / Amortization Net Foxed Assets Total Assets $350,000 $0 5360 DOO $385.000 $350,000 $35.000 3315.000 3423.700 $350.000 $70,000 5280,000 $485 500 $350,000 $350,000 $350,000 $350,000 $105 000 $140,000 $175,000 $210,000 5245.000 $210.000 $175,000 $140.000 $562.500 5625.000 3868,700 5771.500 Current Liabilities (Payables) LT Debt Total Liabities Stock and could retained earings Total Unities and Equity 50 $0 $0 $365.000 5966000 52.700 $0 $2,700 $421 000 $423700 $2,900 50 $2,900 S4A2,500 5485,500 53.100 $3,300 $3,300 $3,300 SO SO 50 $3,100 $3,300 $3,300 $3,300 $549 800 $822 600 5895 400 5768 200 5562,500 $825,900 5690 700 771.500 Working Capital (Non-Cash Current Assets loss Current Liabilities) Change in working capital Projected Free Cash Flows to the Project Net Income Depreciation / Amortization Change in working capital Capital Expenditures (foued assets Cost) Afer tax salvege value Terminal Value) Free Cash Flows IRR Does this beat the WACC? NPV analysis using the WACC) PViCash How Discount rate Payback Analysis (when do cash flows sum positive) Return on invested capital Average forecasted profit net income) Average capital invested and assets) ROTROS Sunrise Bakery Assumptions Expected Investment Cost Risk Free Rate Market Beta Equity Risk Premium Cost of Debt Cost of Equity Tax rate Debt / (Equity+Debt) WACC $350,000 3.00% 0.80 5.50% 4.50% 7.40% 30% 25% Year Income statement (all figures are incremental) Revenue (Sales) Production Costs Depreciation / Amortization Profit Before tax 002359 Taxes Profit after tax (Net Income $1 ($ ($3 ($2 0 $0 $15,000 $9 $1 Projected Balance Sheet Cash and Marketable Sec. Other Current Assets (Inventory and Receivables) Fixed Assets At cost Accumulated Depreciation / Amortization Net Fixed Assets Total Assets $350,000 $0 $350,000 $365,000 $35 $$ $31 $42 $ $o $0 $0 $365,000 $365,000 $ $42 $423 Current Liabilities (Payables) LT Debt Total Liabilities Stock and accumulated retained earnings Total Liabilities and Equity Working Capital (Non-Cash Current Assets less Current Liabilities) Change in working capital Projected Free Cash Flows to the Project Net Income Depreciation / Amortization Change in working capital Capital Expenditures (fixed assets at cost) After tax salvage value Terminal Value) Free Cash Flows $350,000 3.00% 0.80 5.50% 4.50% 7.40% 30% 25% 0 1 $135,000 ($20,000) ($35,000) $80,000 ($24,000) $56,000 2 $145,000 ($22,000) ($35,000) $88,000 ($26.400) $61,600 3 5 $155,000 $165,000 $165,000 $165,000 ($24,000) ($26,000) ($26,000) ($26,000) ($35,000) ($35.000 ($35,000) ($35,000) $96,000 $104,000 $104,000 $104,000 ($28,800) ($31,200) ($31,200) ($31, 200) $67,200 $72,800 $72,800 $72,800 0 $0 $15,000 1 $91,675 $17,025 2 $188,325 $17,175 3 4 5 6 $290,575 $398,425 $506,225 $614,025 $17,325 $17,475 $17,475 $17,475 $350,000 $0 $350,000 $365,000 $350,000 $35,000 $315,000 $423,700 $350,000 $70,000 $280,000 $485,500 $350,000 $350,000 $350,000 $350,000 $105,000 $140.000 $175,000 $210,000 $245,000 $210,000 $175,000 $140,000 $552,900 $625,900 $698,700 $771.500 $O $0 $0 $365,000 $365,000 $2,700 $O $2,700 $421,000 $423,700 $2,900 $0 $2,900 $482.600 $485,500 $3,100 $3,300 $3,300 $3,300 $0 $0 $O $0 $3,100 $3,300 $3,300 $3,300 $549,800 $622,600 $695,400 $768,200 $552,900 $625,900 $698,700 $771,500 iabilities) Does this beat the WACC? 0 2 5 Sunrise Bakery Assumptions Expected investment Cost Risk Free Rate Market Beta Equity Risk Premium Cost of Debt Cost of Equity Tax rate Debt / (Equity Den WAGO $350,000 3.00% 0.80 5.60% 4.50% 7.40% 30% Year Income statement (all figures are incremental) Revenue (Sales) Production Costs Depreciation / Amortization Profit Before tax Taxes Profiter tax Net Income 1 $135,000 (520,000) 1$35,000) $80,000 1524.000) $53,000 2 $145,000 (522,000) (535.000) $88.000 $26.400) $51,600 3 $155,000 3165,000 $165.000 $165,000 (524,000) ($20,000) (526,000) (526,000) 15350000335.000 535.000) (535 000) $96.000 $104,000 $104,000 $104.000 (528.800531200831200831 200 $67200 $72.800 $72,800 $72,800 $0 $15,000 $91,675 $17,025 2 $188,325 $17,175 Projected Balance Sheet Cash and Marketable Sec Other Current Assets (Inventory and Receivables) Fixed Assets Al cost Accumulated Depreciation Amortization Net Fixed Assets Total Assets 3 4 5 6 $290,575 333,425 $506 225 5614025 $17,325 $17.475 $17.475 $17,475 $350,000 50 $350.000 $385.000 $350,000 $35.000 $315.000 3423,700 $350.000 $70,000 $280.000 5485,500 $350,000 $350,000 $350,000 $350,000 $105.000 5140 000 $175,000 $210 000 $245 000 $ 210 000 $175,000 $140,000 3562300 $625.9003008700 5771,500 Current Liabilities ( Payables) LT Debt Totabilities Stock and accumulated retained earnings Total Labilities and Equity $0 50 $0 $365.000 3365.000 52,700 50 $2.700 $421.000 $423 700 $2.000 30 52.800 $482.600 $426,600 $3,100 $3.300 $3,300 $3,300 SO SO $0 $0 $3,100 $3,300 $3,300 $3,300 $549,800 $622 600 $695,400 $768 200 356200 $625000 $398 700 5771,300 Working Capital (Non-Cash Current Assets loss Current Liabilities) Change in working capital Projected Free Cash Flows to the Project The Income Depreciation / Amortization Change in working capital Capital Expenditures freed assets to Aber tax savo vale Terminal Value Free Cash Flows IRR Does this beat the WACC? NPV analysis using the WACC) Prvi Cashow Discount rate NPV Payback Analysis (when do cash flow sum positive) Return on invested capital Average forecasted profit net income Average capital invested not found assets)
Step by Step Solution
There are 3 Steps involved in it

Get step-by-step solutions from verified subject matter experts