

Question: Need help with Multiple linear regresison problem ASAP. See attached for documentaiton MathtHourstMajor 80t5tScience 50t3tScience 30t2tScience 20t1tScience 60t4tScience 78t3tEngineering 43t1tEngineering 103t5tEngineering 48t2tEngineering 80t4tEngineering 38t2tHistory 69t4tHistory
Need help with Multiple linear regresison problem ASAP. See attached for documentaiton
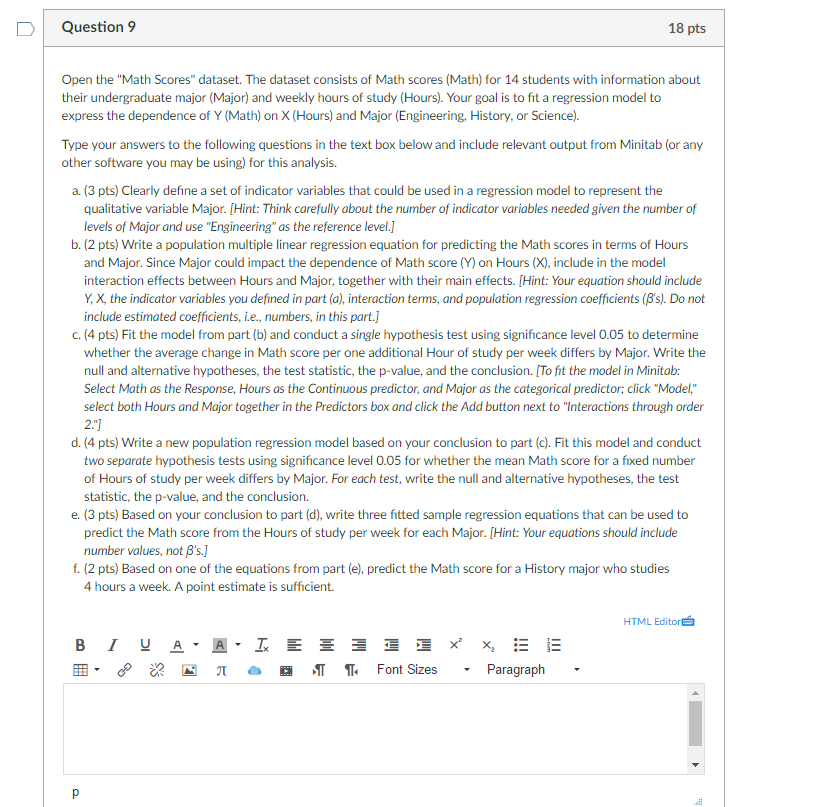
Math\tHours\tMajor 80\t5\tScience 50\t3\tScience 30\t2\tScience 20\t1\tScience 60\t4\tScience 78\t3\tEngineering 43\t1\tEngineering 103\t5\tEngineering 48\t2\tEngineering 80\t4\tEngineering 38\t2\tHistory 69\t4\tHistory 23\t1\tHistory 24\t1\tHistory Question 9 13 pts Open the "Math Scores" dataset. The dataset consists of Math scores {Math} for 14 students with information about their undergraduate major {Major} and weekly hours of study {Hours}. Your goal is to t a regression model to express the dependence of Y {Math} on X {Hours} and Major (Engineering. History, or Scienoe]. Type your answers to the following questions in the text box below and include relevant output from Minitab [or any other software you may be using) for this analysis. a. {3 pts} Clearly dene a set of indicator variables that could be used in a regression model to represent the qualitative variable Major. IHint: Think carefully about the number of indicator variables needed given the number of levels of Major and use "Engineering\" as the reference leyelJ b. {2 pts} Write a population multiple linear regression equation for predicting the Math scores in terms of Hours and Major. Sinoe Major could impact the dependenoe of Math score {Y} on Hours (3-1}, include in the model interaction effects between Hours and Major. together with their main effects. IHint: Your equation should include Y, )t, the indicator variables you defined in part in}. interaction terms, and population regression coefcients [E's]. Do not include estimated coefcientsr i.e., numbers, in this part] c. {4 pts} Flt the model from part {b] and conduct a single hypothesis test using signicance level {1.05 to determine whether the average change in Math score per one additional Hour of study per week differs by Major. Write the null and alternative hypotheses, the test statistic, the p-value. and the conclusion. [1' o fit the model in Minitab: Select Math as the Response. Hours as the Continuous predictor; and Major as the categorical predictors click \"Model," select both Hours and Major together in the Predictors box and click the Add button next to "interactions through order 2'."j d. {4 pts} Write a new population regression model based on your conclusion to part {c}. Flt this model and conduct two separate hypothesis tests using signicance level 0.05 for whether the mean Math score for a xed number of Hours of study per week differs by Major. For each test. write the null and alternative hypotheses, the test statistic, the p-yalue. and the conclusion. e. {3 pts} Based on your oonclusion to part {d}, write three fitted sample regression equations that can be used to predict the Math score from the Hours of study per week for each Major. {Hint- Your equations should include number Irallies, not ,G'sj f. {2 pts} Based on one of the equations from part {e}. predict the Math score for a History major who studies 4 hours a week A point estimate is sufficient. HTMLEditm-a BIHL'I'EEEEEEX'EEEE Ev o9 as E :II a n .11 in FontSizes v Paragraph
Step by Step Solution
There are 3 Steps involved in it

Get step-by-step solutions from verified subject matter experts