

Question: need help with part 2 conclusion Report your data in the table below. Calculate values for the last two rows using 2 sig figs. Temperature
need help with part 2 conclusion
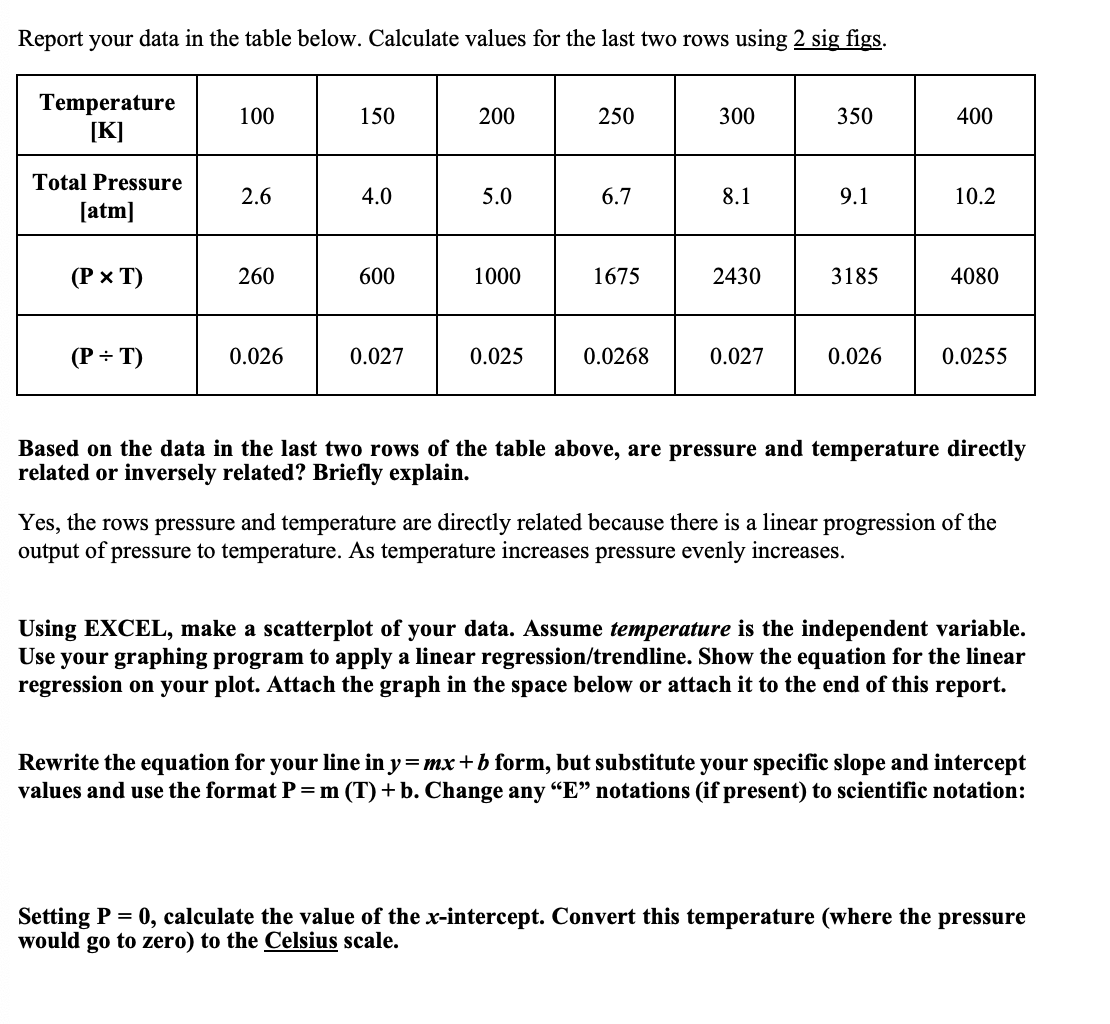
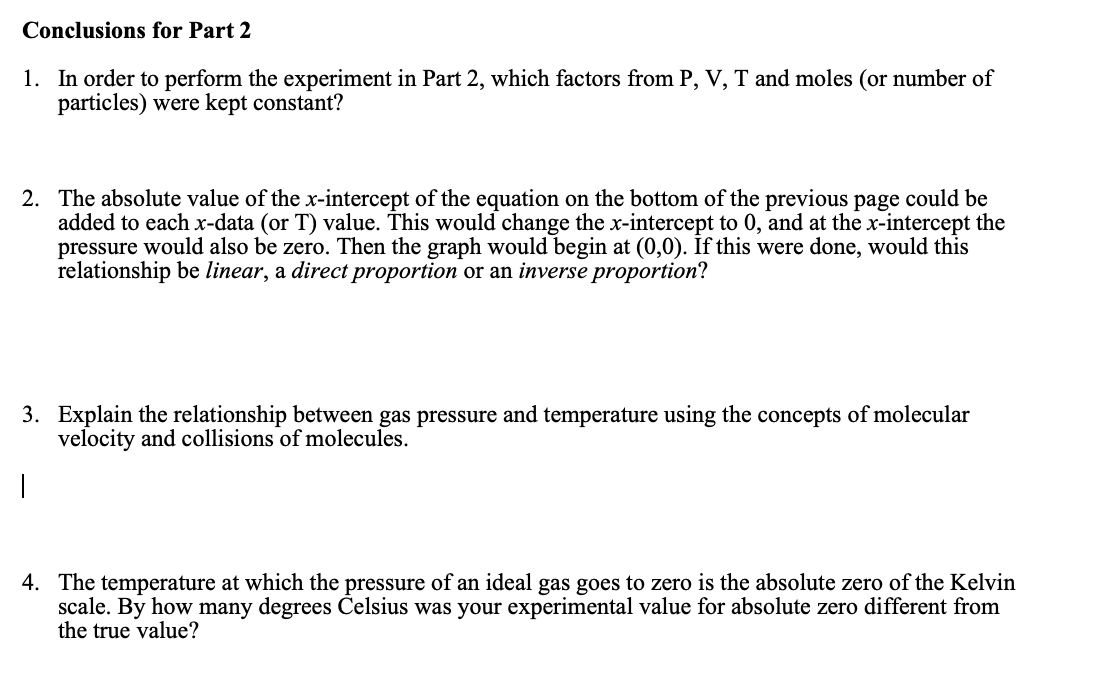
Report your data in the table below. Calculate values for the last two rows using 2 sig figs. Temperature [K] 100 150 200 250 300 350 400 Total Pressure [atm] 2.6 4.0 5.0 6.7 8.1 9.1 10.2 (P x T) 260 600 1000 1675 2430 3185 4080 (P = T) 0.026 0.027 0.025 0.0268 0.027 0.026 0.0255 Based on the data in the last two rows of the table above, are pressure and temperature directly related or inversely related? Briefly explain. Yes, the rows pressure and temperature are directly related because there is a linear progression of the output of pressure to temperature. As temperature increases pressure evenly increases. Using EXCEL, make a scatterplot of your data. Assume temperature is the independent variable. Use your graphing program to apply a linear regression/trendline. Show the equation for the linear regression on your plot. Attach the graph in the space below or attach it to the end of this report. Rewrite the equation for your line in y=mx+b form, but substitute your specific slope and intercept values and use the format P=m (T) + b. Change any E notations (if present) to scientific notation: Setting P = 0, calculate the value of the x-intercept. Convert this temperature (where the pressure would go to zero) to the Celsius scale. Conclusions for Part 2 1. In order to perform the experiment in Part 2, which factors from P, V, T and moles (or number of particles) were kept constant? 2. The absolute value of the x-intercept of the equation on the bottom of the previous page could be added to each x-data (or T) value. This would change the x-intercept to 0, and at the x-intercept the pressure would also be zero. Then the graph would begin at (0,0). If this were done, would this relationship be linear, a direct proportion or an inverse proportion? 3. Explain the relationship between gas pressure and temperature using the concepts of molecular velocity and collisions of molecules. | 4. The temperature at which the pressure of an ideal gas goes to zero is the absolute zero of the Kelvin scale. By how many degrees Celsius was your experimental value for absolute zero different from the true value
Step by Step Solution
There are 3 Steps involved in it

Get step-by-step solutions from verified subject matter experts