

Question: Report your data in the table below. Calculate values for the last two rows using 2 sig figs. Temperature [K] 100 150 200 250 300
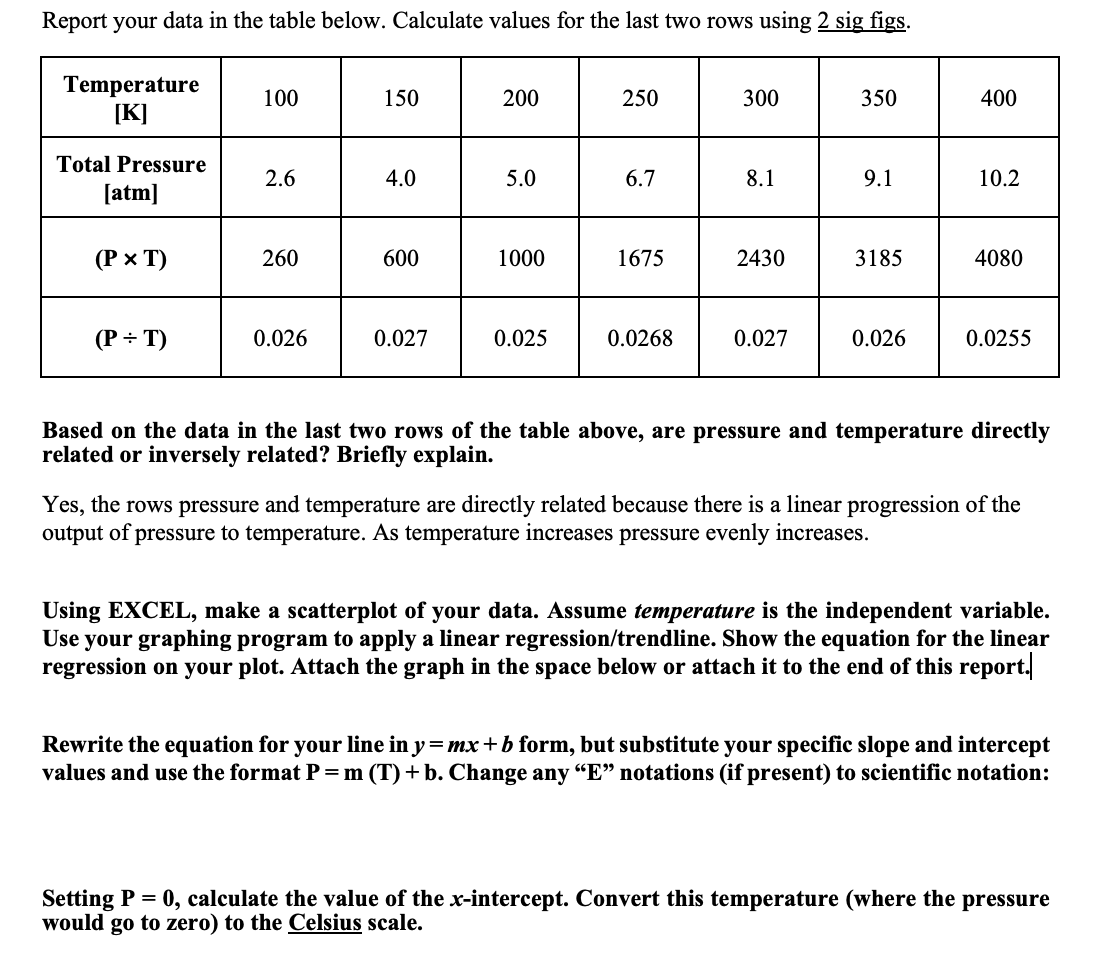
Report your data in the table below. Calculate values for the last two rows using 2 sig figs. Temperature [K] 100 150 200 250 300 350 400 Total Pressure [atm] 2.6 4.0 5.0 6.7 8.1 9.1 10.2 (P x T) 260 600 1000 1675 2430 3185 4080 (P = T) 0.026 0.027 0.025 0.0268 0.027 0.026 0.0255 Based on the data in the last two rows of the table above, are pressure and temperature directly related or inversely related? Briefly explain. Yes, the rows pressure and temperature are directly related because there is a linear progression of the output of pressure to temperature. As temperature increases pressure evenly increases. Using EXCEL, make a scatterplot of your data. Assume temperature is the independent variable. Use your graphing program to apply a linear regression/trendline. Show the equation for the linear regression on your plot. Attach the graph in the space below or attach it to the end of this report. Rewrite the equation for your line in y=mx+b form, but substitute your specific slope and intercept values and use the format P=m (T) + b. Change any E notations (if present) to scientific notation: Setting P = 0, calculate the value of the x-intercept. Convert this temperature (where the pressure would go to zero) to the Celsius scale
Step by Step Solution
There are 3 Steps involved in it

Get step-by-step solutions from verified subject matter experts