Question: Need help with part 3 and 4 please 3) You are a security analyst responsible for following Jaguar's stock after it floats. (Assume the company
Need help with part 3 and 4 please
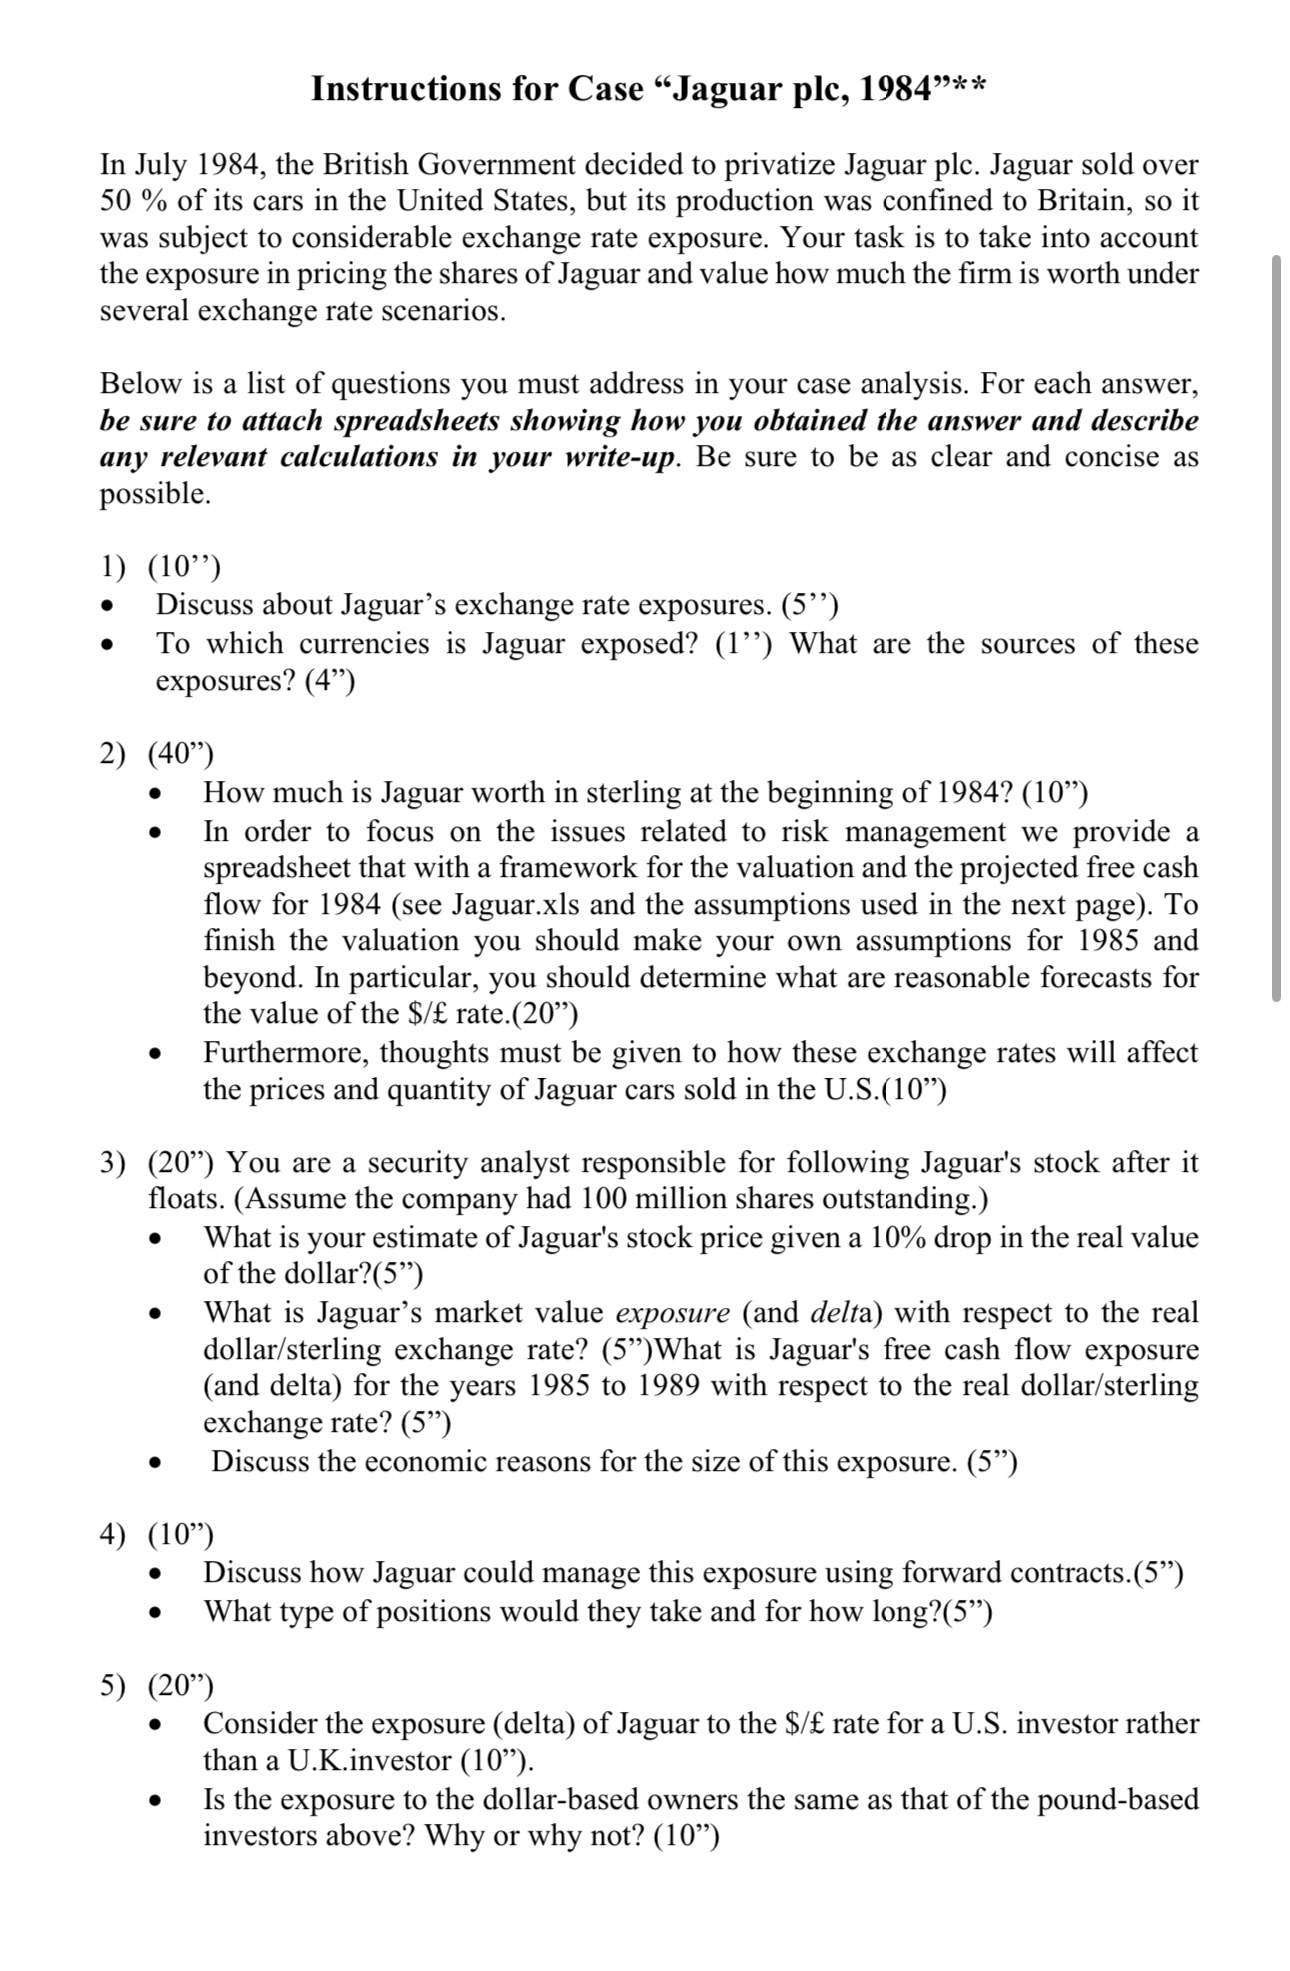
3) You are a security analyst responsible for following Jaguar's stock after it floats. (Assume the company had 100 million shares outstanding.) What is your estimate of Jaguar's stock price given a 10% drop in the real value of the dollar? What is Jaguar's market value exposure (and delta) with respect to the real dollar/sterling exchange rate? What is Jaguar's free cash flow exposure (and delta) for the years 1985 to 1989 with respect to the real dollar/sterling exchange rate? Discuss the economic reasons for the size of this exposure.
4) Discuss how Jaguar could manage this exposure using forward contracts. What type of positions would they take and for how long?
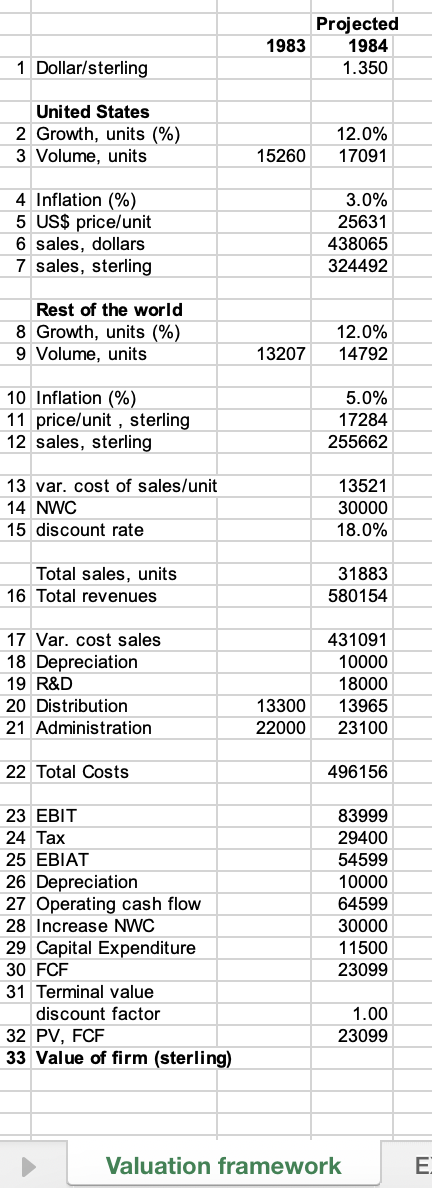
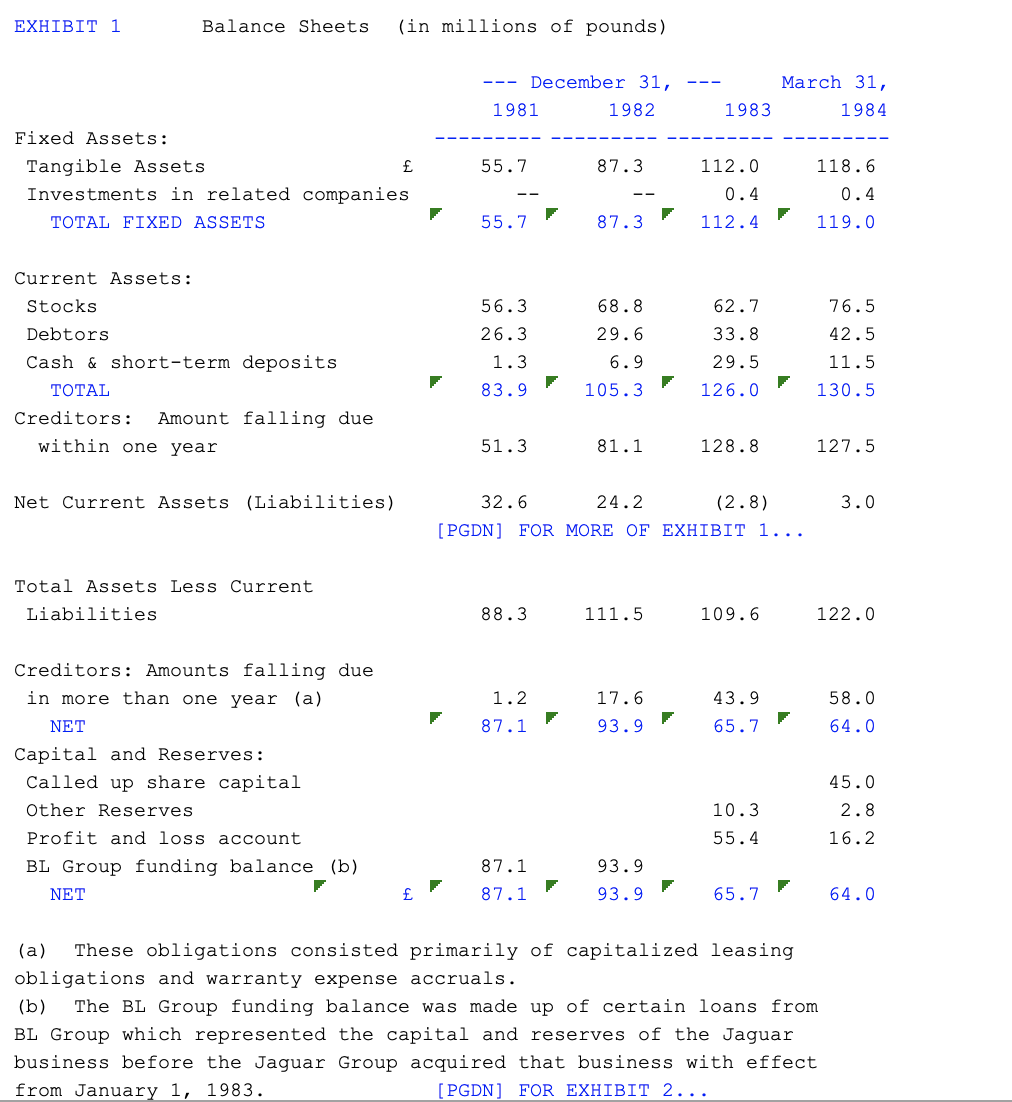
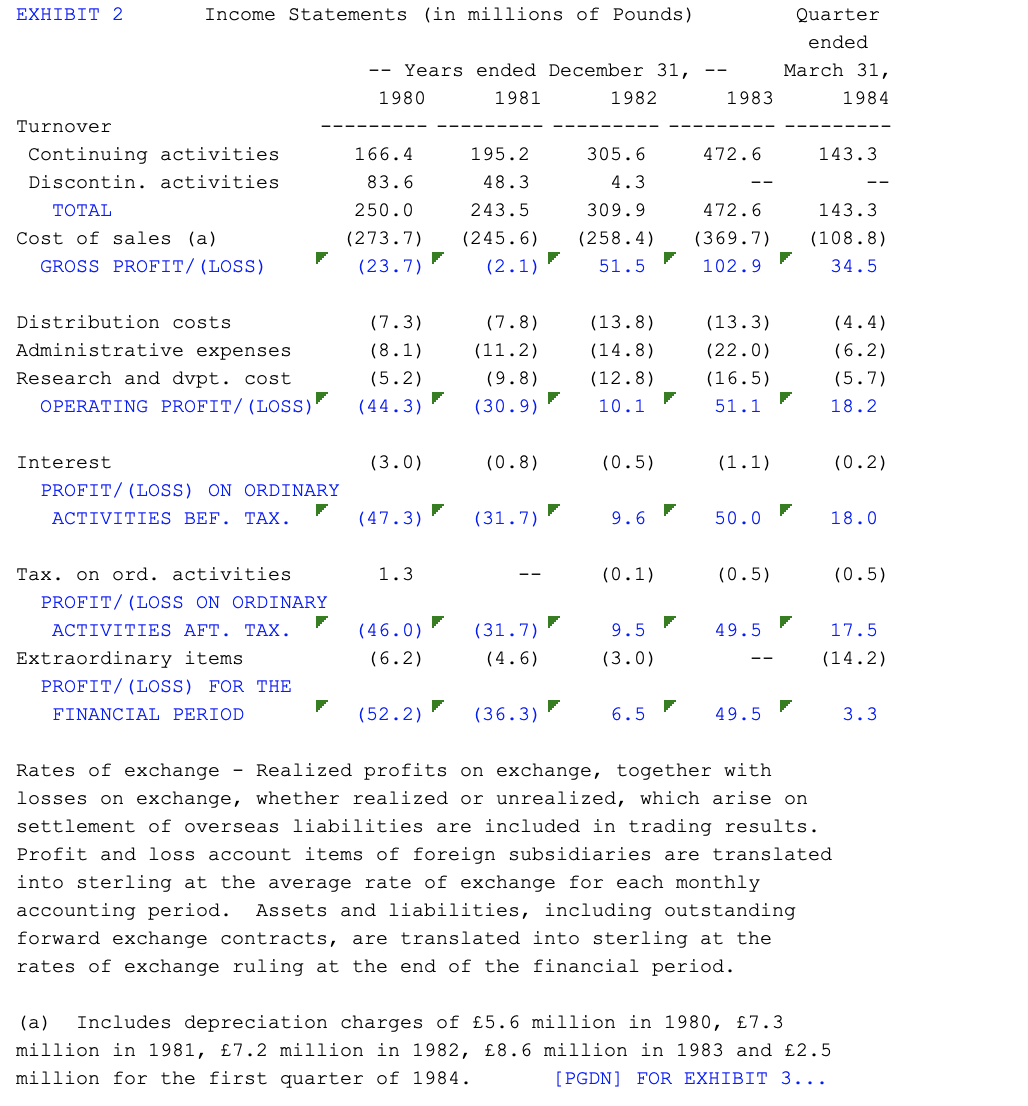
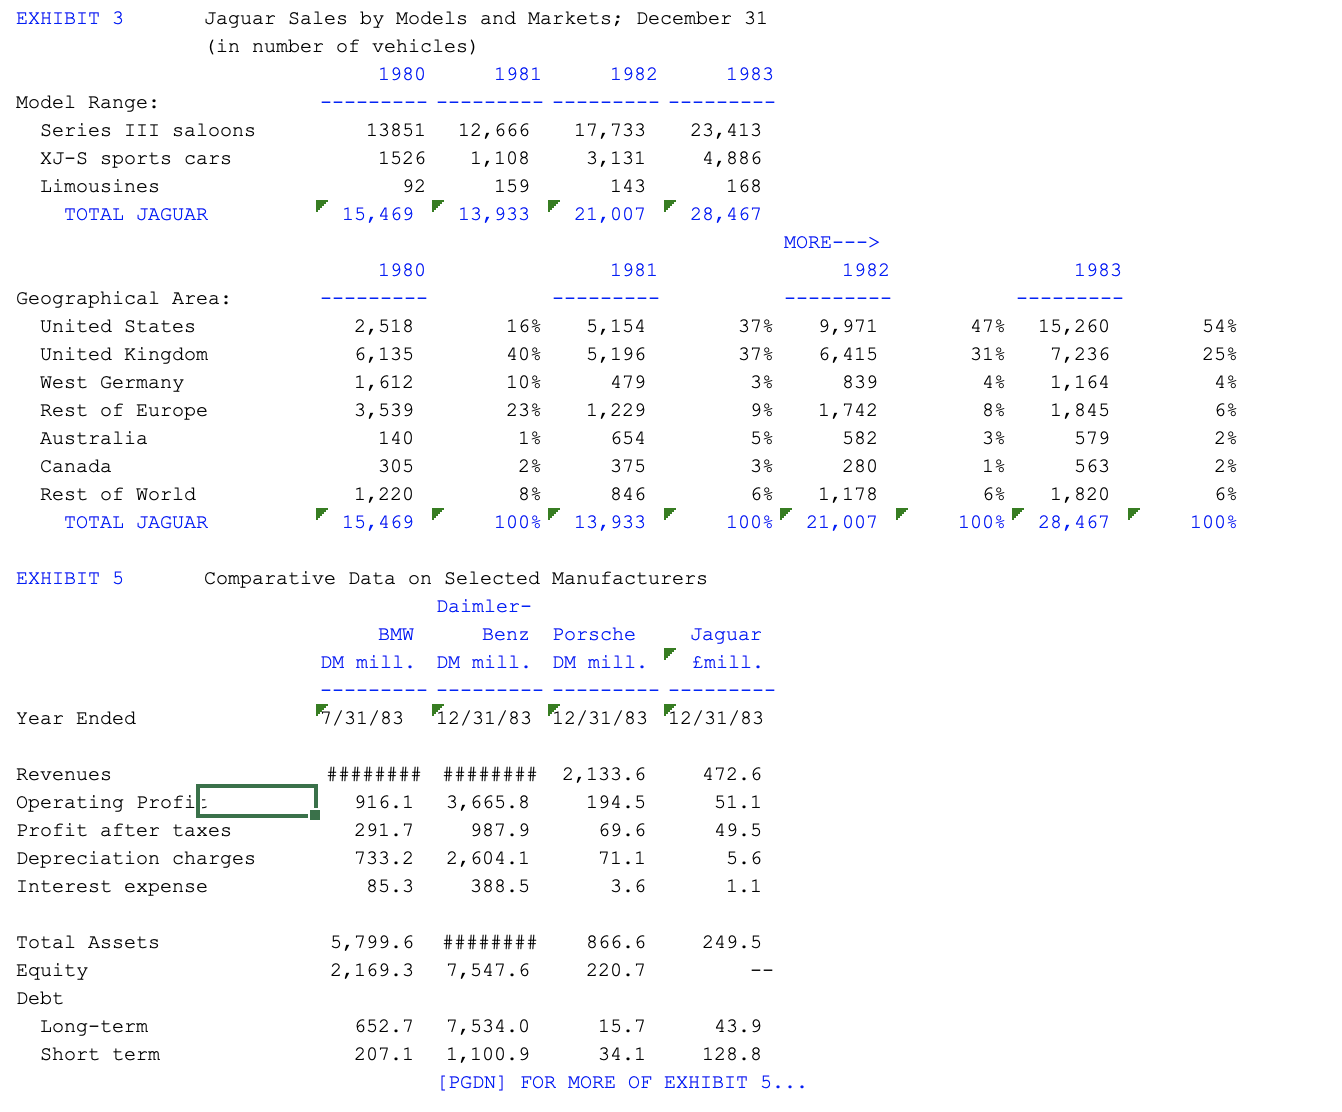
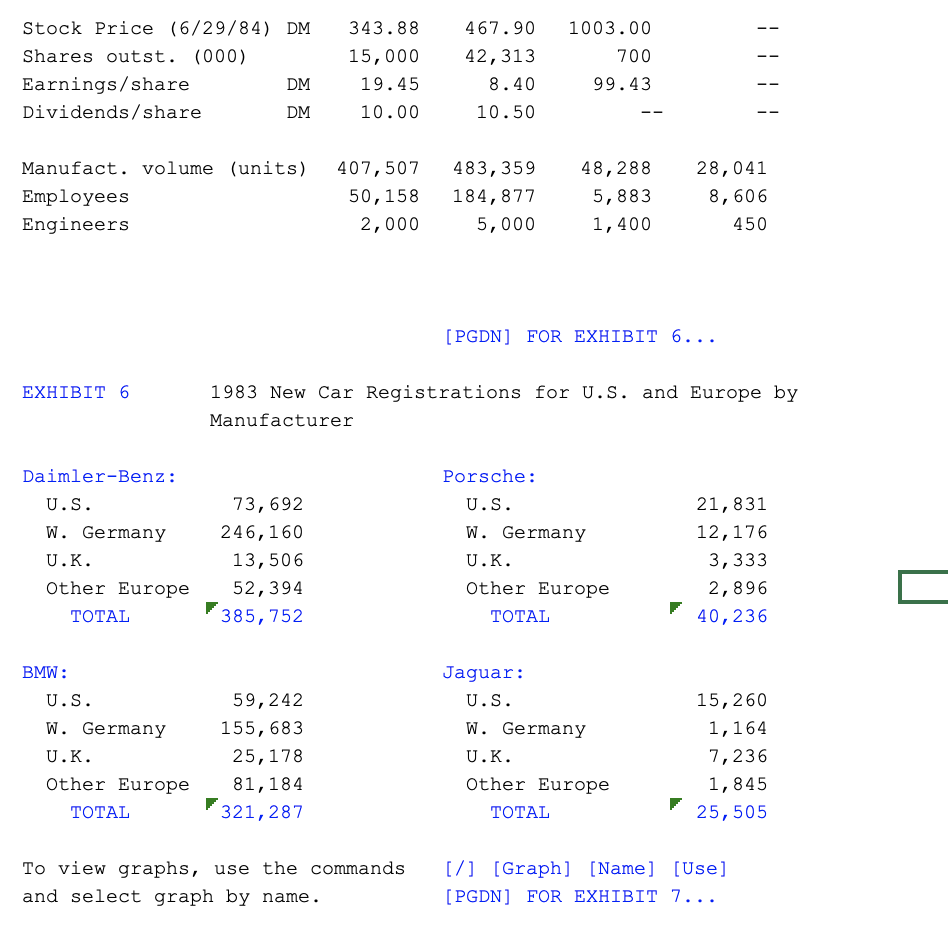
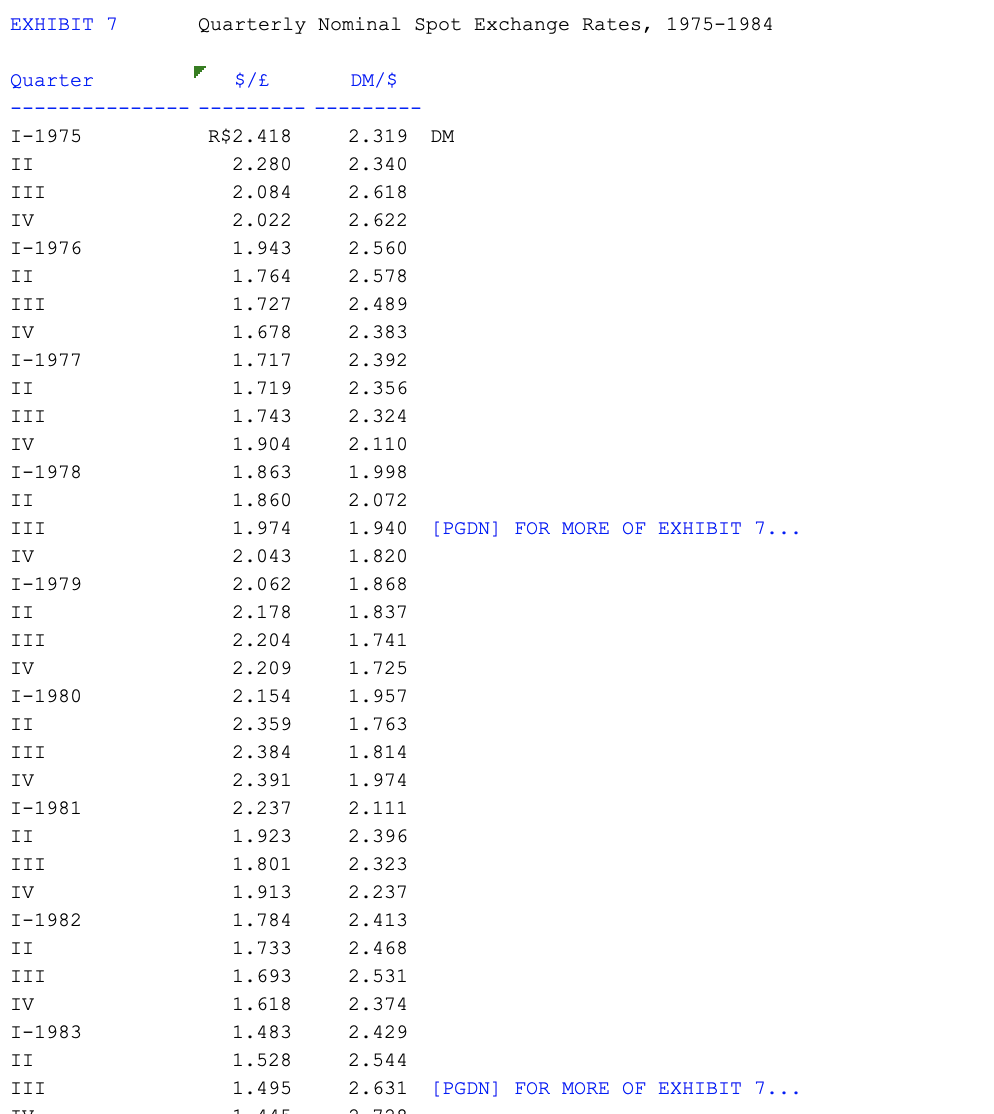
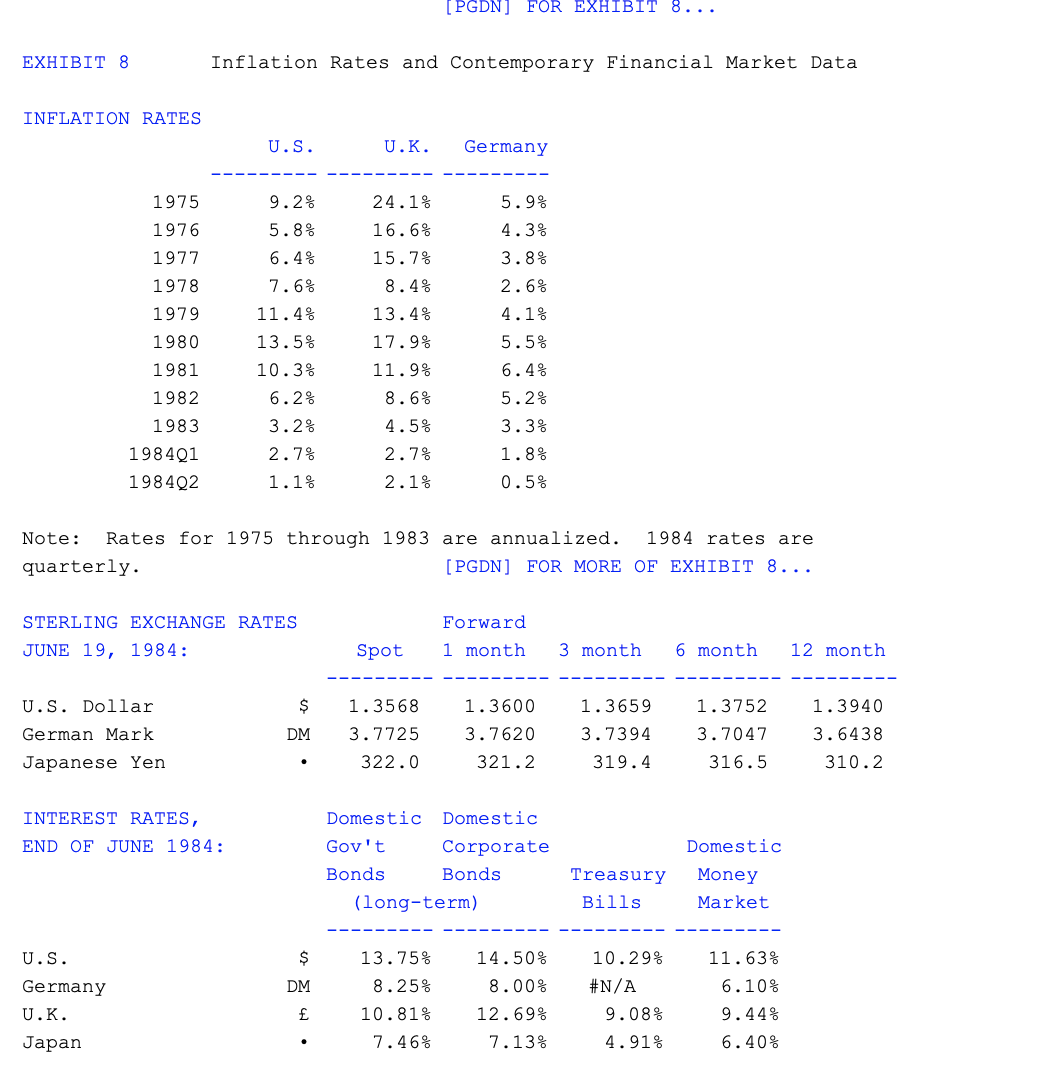
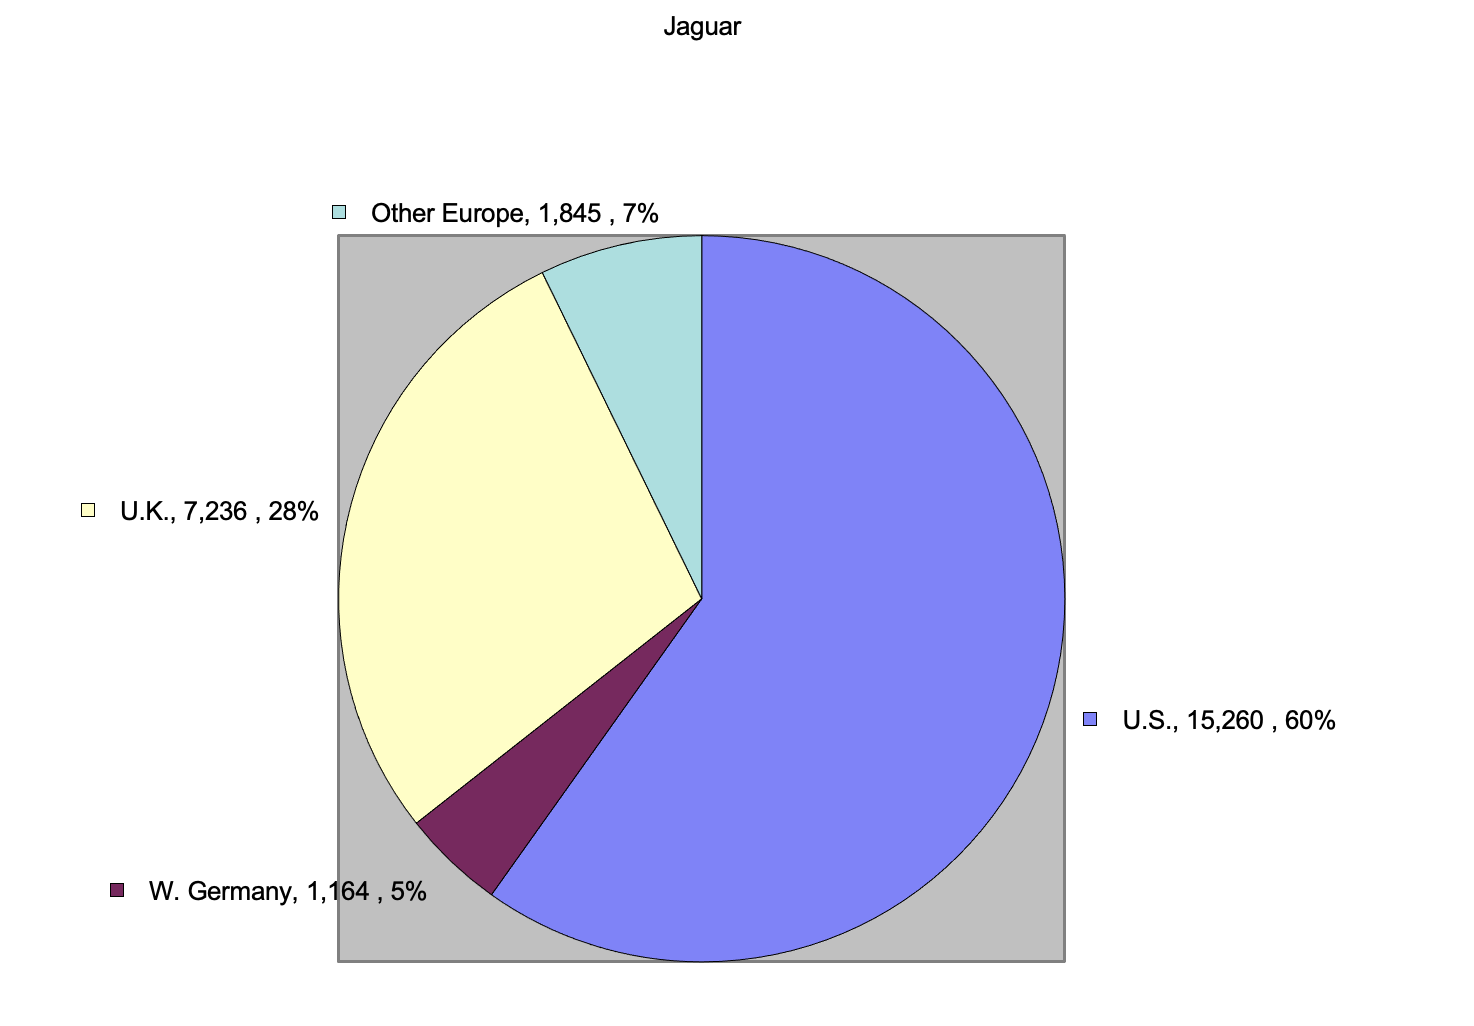
General Instructions on Project Each group needs to make only one submission using the Canvas Assignment Dropbox. Each submission should include one written report and one accompanying excel sheet. Please do not just embed or copy the sheet in the report as the professor needs to open your sheet and look over the calculations therein for grading. Write down each group member's name on the front page of the report. The professor will grade each group's project analysis according to the Rubrics posted in Canvas. Each member of the group will receive the same grade. Groups will be formed by the professor within one week after this instruction is distributed. Each group typically consists of four students. Please check Canvas to find out your group members. Note that you are responsible for setting up a scheme to coordinate each group member's efforts on this project. Free-riders are NOT welcome. The group can vote with a majority to kick the free-rider out of his/her group in that case, the one who is kicked out will receive zero grade on the project or work on the project by him/herself. You may find it useful to take a look at the slides: \"jaguar_introduction.pptx\", available in Canvas, before you get started. Recommended Format of the Project Analysis [No need to follow!!] 1. I would suggest one format of the report as follows (obviously, you do not have to follow this format and BE CREATIVE): Part I: Introduction (background analysis) Part II: Models (like valuation model, pricing model, exchange rate determination model, exposure measurement and management model, etc...) Part ITI. Results (your empirical analysis and explanations); Part IV. Conclusions (to summarize main results); Part V. Appendix (basically spreadsheets/tables/figures); Part V1. References (if any, like newspapers, journals, articles, etc) 2. Some details about the written analysis: e The bottom line is that you have to answer all 5 questions (page 2 of this Instruction) based on the given assumptions and cash-flow structure (page 3 of this Instruction). e In case you need to make additional assumptions necessary for you to solve the problems, please state clearly those in the written report. e Tips listed in page 4 of this Instruction offer some useful guidance to conduct analysis. e The report should be double-spaced, 11- or 12- font-sized, and four-to-ten-page long (not including spreadsheets/tables/figures/references). Instructions for Case \"Jaguar plc, 1984\"** In July 1984, the British Government decided to privatize Jaguar plc. Jaguar sold over 50 % of its cars in the United States, but its production was confined to Britain, so it was subject to considerable exchange rate exposure. Your task is to take into account the exposure in pricing the shares of Jaguar and value how much the firm is worth under several exchange rate scenarios. Below is a list of questions you must address in your case analysis. For each answer, be sure to attach spreadsheets showing how you obtained the answer and describe any relevant calculations in your write-up. Be sure to be as clear and concise as possible. 1) 2) 3) 4) ) (10) Discuss about Jaguar's exchange rate exposures. (57) To which currencies is Jaguar exposed? (1') What are the sources of these exposures? (47) (407) How much is Jaguar worth in sterling at the beginning of 19847 (10\") In order to focus on the issues related to risk management we provide a spreadsheet that with a framework for the valuation and the projected free cash flow for 1984 (see Jaguar.xls and the assumptions used in the next page). To finish the valuation you should make your own assumptions for 1985 and beyond. In particular, you should determine what are reasonable forecasts for the value of the $/ rate.(20) Furthermore, thoughts must be given to how these exchange rates will affect the prices and quantity of Jaguar cars sold in the U.S.(107) (20\") You are a security analyst responsible for following Jaguar's stock after it floats. (Assume the company had 100 million shares outstanding.) What is your estimate of Jaguar's stock price given a 10% drop in the real value of the dollar?(5\") What is Jaguar's market value exposure (and delta) with respect to the real dollar/sterling exchange rate? (5\")What is Jaguar's free cash flow exposure (and delta) for the years 1985 to 1989 with respect to the real dollar/sterling exchange rate? (57) Discuss the economic reasons for the size of this exposure. (57) (107) . Discuss how Jaguar could manage this exposure using forward contracts.(5\") What type of positions would they take and for how long?(5\") (207) . Consider the exposure (delta) of Jaguar to the $/ rate for a U.S. investor rather than a U.K.investor (10\"). Is the exposure to the dollar-based owners the same as that of the pound-based investors above? Why or why not? (10) Projected 1983 1984 1 Dollar/sterling 1.350 United States 2 Growth, units (%) 12.0% 3 Volume, units 15260 17091 4 Inflation (%) 3.0% 5 US$ price/unit 25631 6 sales, dollars 438065 7 sales, sterling 324492 Rest of the world 8 Growth, units (%) 12.0% 9 Volume, units 13207 14792 10 Inflation (%) 5.0% 11 price/unit , sterling 17284 12 sales, sterling 255662 13 var. cost of sales/unit 13521 14 NWC 30000 15 discount rate 18.0% Total sales, units 31883 16 Total revenues 580154 17 Var. cost sales 431091 18 Depreciation 10000 19 R&D 18000 20 Distribution 13300 13965 21 Administration 22000 23100 22 Total Costs 496156 23 EBIT 83999 24 Tax 29400 25 EBIAT 54599 26 Depreciation 10000 27 Operating cash flow 64599 28 Increase NWC 30000 29 Capital Expenditure 1 1500 30 FCF 23099 31 Terminal value discount factor 1.00 32 PV, FCF 23099 33 Value of firm (sterling) Valuation framework EEXHIBIT 1 Balance Sheets (in millions of pounds) -- December 31, --- March 31, 1981 1982 1983 1984 Fixed Assets: 0 mmmmm e m s o s e Tangible Assets 55.7 87.3 112.0 118.6 Investments in related companies -- -- 0.4 0.4 TOTAL FIXED ASSETS F s55.7F 87.3F 112.4 F 119.0 Current Assets: Stocks 56.3 68.8 62.7 76.5 Debtors 26.3 29.6 33.8 42.5 Cash & short-term deposits 1.3 6.9 29.5 11.5 TOTAL 83.9F 105.3 F 126.0 F 130.5 Creditors: Amount falling due within one year 51.3 81.1 128.8 127.5 Net Current Assets (Liabilities) 32.6 24.2 (2.8) 3.0 [PGDN] FOR MORE OF EXHIBIT 1... Total Assets Less Current Liabilities 88.3 111.5 109.6 122.0 Creditors: Amounts falling due in more than one year (a) 1.2 17.6 43,9 58.0 NET F 87.1F 939 F 657 F 640 Capital and Reserves: Called up share capital 45.0 Other Reserves 10.3 2.8 Profit and loss account 55.4 16.2 BL Group funding balance (b) 87.1 93.9 NET 7.1 F 93.9F 65.7F a0 {(a) These obligations consisted primarily of capitalized leasing obligations and warranty expense accruals. {(b) The BL Group funding balance was made up of certain loans from BL Group which represented the capital and reserves of the Jaguar business before the Jaguar Group acquired that business with effect from January 1, 1983. [PGDN] FOR EXHIBIT 2... EXHIBIT 2 Income Statements (in millions of Pounds) Quarter ended -= Years ended December 31, -- March 31, 1980 1981 1982 1983 1984 Turnover 0 e m e s m e Continuing activities 166.4 195.2 305.6 472.6 143.3 Discontin. activities 83.6 48 .3 4.3 -- - TOTAL 250.0 243.5 309.9 472.6 143.3 Cost of sales (a) (273.7) (245.6) (258.4) (369.7) (108.8) GROSS PROFIT/ (LOSS) F oo23.nF 2.1 51.5 F 102.9 F 34.5 Distribution costs (7.3) (7.8) (13.8) (13.3) (4.4) Administrative expenses (8.1) (11.2) (14.8) (22.0) (6.2) Research and dvpt. cost (5.2) (9.8) (12.8) (16.5) (5.7) OPERATING PROFIT/(LosS) (44.3)F @0o.99F 10.1 F s51.1 F 18.2 Interest (3.0) (0.8) (0.5) (1.1) (0.2) PROFIT/ (LOSS) ON ORDINARY ACTIVITIES BEF. TaXx. ' (47.3)F @31.nF 9.6 F s0.0 F 18.0 Tax. on ord. activities 1.3 - (0.1) (0.5) (0.5) PROFIT/ (LOSS ON ORDINARY ACTIVITIES AFT. TAX. ' (46.0)%F 31.1) " 9.5 F 495 F 17.5 Extraordinary items (6.2) (4.6) (3.0) - (14.2) PROFIT/ (LOSS) FOR THE FINANCIAL PERIOD F o52.2)F (36.5)F 6.5 F 49,5 F 3.3 Rates of exchange - Realized profits on exchange, together with losses on exchange, whether realized or unrealized, which arise on settlement of overseas liabilities are included in trading results. Profit and loss account items of foreign subsidiaries are translated into sterling at the average rate of exchange for each monthly accounting period. Assets and liabilities, including outstanding forward exchange contracts, are translated into sterling at the rates of exchange ruling at the end of the financial period. (2) Includes depreciation charges of 5.6 million in 1980, 7.3 million in 1981, 7.2 million in 1982, 8.6 million in 1983 and 2.5 million for the first quarter of 1984. [PGDN] FOR EXHIBIT 3... EXHIBIT 3 Jaguar Sales by Models and Markets; December 31 (in number of vehicles) 1980 1981 1982 1983 Model Range : Series III saloons 13851 12, 666 17, 733 23, 413 XJ-S sports cars 1526 1, 108 3, 131 4, 886 Limousines 92 159 143 168 TOTAL JAGUAR F 15, 469 13, 933 F 21, 007 28 , 467 MORE---> 1980 1981 1982 1983 Geographical Area: United States 2, 518 168 5, 154 378 9, 971 47% 15, 260 54% United Kingdom 6, 135 10% 5 , 196 37% 6, 415 318 7, 236 25% West Germany 1, 612 10% 479 3% 839 1, 164 4% Rest of Europe 3, 539 23% 1, 229 9% 1, 742 8% 1, 845 6% Australia 140 18 654 5% 582 3% 579 2% Canada 305 2% 375 38 280 563 2% Rest of World 1, 220 8% 846 1, 178 68 1, 820 6% TOTAL JAGUAR F 15 , 469 100% 13, 933 100% 21 , 007 F 100% 28 , 467 100% EXHIBIT 5 Comparative Data on Selected Manufacturers Daimler- BMW Benz Porsche Jaguar DM mill. DM mill. DM mill. Emill . Year Ended 7/31/83 12/31/83 12/31/83 12/31/83 Revenues # # ###### ######## 2, 133.6 472. 6 Operating Profi : 916.1 3, 665. 8 194.5 51 . 1 Profit after taxes 291 .7 987.9 69.6 49.5 Depreciation charges 733.2 2, 604. 1 71 . 1 5. 6 Interest expense 85.3 388.5 3 . 6 1 . 1 Total Assets 5 , 799.6 # # # # ### # 866. 6 249.5 Equity 2, 169.3 7 , 547. 6 220.7 Debt Long-term 652.7 7 , 534.0 15.7 43.9 Short term 207.1 1, 100.9 34 .1 128.8 [ PGDN ] FOR MORE OF EXHIBIT 5 . ..Stock Price (6/29/84) DM 343. 88 467 .90 1003.00 Shares outsto00) 15, 000 42, 313 700 Earnings / share DM 19.45 8 . 40 99. 43 Dividends /share DM 10.00 10 .50 Manufact. volume (units) 407, 507 483, 359 48, 288 28, 041 Employees 50, 158 184, 877 5 , 883 8, 606 Engineers 2, 000 5, 000 1, 400 450 [PGDN ] FOR EXHIBIT 6 . . . EXHIBIT 6 1983 New Car Registrations for U. S. and Europe by Manufacturer Daimler-Benz : Porsche : U. S. 73, 692 U. S. 21, 831 W. Germany 246, 160 W. Germany 12, 176 U. K. 13, 506 U . K. 3, 333 Other Europe 52, 394 Other Europe 2, 896 TOTAL 385, 752 TOTAL 40, 236 BMW : Jaguar : U. S. 59, 242 U. S. 15, 260 W. Germany 155, 683 W. Germany 1, 164 U. K. 25, 178 U . K. 7, 236 Other Europe 81 , 184 Other Europe 1, 845 TOTAL 321, 287 TOTAL 25, 505 To view graphs, use the commands [/] [Graph] [Name] [Use] and select graph by name. [PGDN ] FOR EXHIBIT 7. . .EXHIBIT 7 Quarterly Nominal Spot Exchange Rates, 1975-1984 Quarter $ / E DM/ $ I-1975 R$2 . 418 2. 319 DM II 2.280 2. 340 III 2. 084 2 . 618 IV 2. 022 2. 622 I-1976 1.943 2. 560 II 1 . 764 2. 578 III 1. 727 2. 489 IV 1 . 678 2.383 I-1977 1 . 717 2. 392 II 1. 719 2. 356 III 1. 743 2. 324 IV 1. 904 2. 110 I-1978 1.863 1. 998 II 1. 860 2. 072 III 1. 974 1 . 940 [ PGDN ] FOR MORE OF EXHIBIT 7 . . . IV 2. 043 1. 820 I-1979 2. 062 1 . 868 II 2. 178 1. 837 III 2. 204 1 . 741 IV 2. 209 1. 725 I-1980 2. 154 1. 957 II 2.359 1 . 763 III 2. 384 1 . 814 IV 2. 391 1. 974 I-1981 2.237 2. 111 II 1. 923 2.396 III 1 . 801 2.323 IV 1. 913 2.237 I-1982 1 . 784 2. 413 II 1. 733 2 . 468 III 1 . 693 2. 531 IV 1 . 618 2.374 I-1983 1. 483 2. 429 II 1. 528 2. 544 III 1. 495 2. 631 [ PGDN ] FOR MORE OF EXHIBIT 7 . ..[PGDN ] FOR EXHIBIT 8 . . . EXHIBIT 8 Inflation Rates and Contemporary Financial Market Data INFLATION RATES U. S. U. K. Germany 1975 9.28 24.18 5.9% 1976 5 . 8 : 16. 68 4.38 1977 6. 4% 15 . 78 3.8% 1978 7. 6: 8. 4% 2 .68 1979 11 . 4% 13 . 4% 4. 18 1980 13 . 5: 17.98 5 . 5% 1981 10.38 11 .98 6.4% 1982 6 .28 8. 6% 5 . 28 1983 3. 28 4. 5% 3.3% 198401 2. 78 2. 78 1. 8. 198402 1 . 18 2. 18 0 . 5% Note: Rates for 1975 through 1983 are annualized. 1984 rates are quarterly. [PGDN] FOR MORE OF EXHIBIT 8 ... STERLING EXCHANGE RATES Forward JUNE 19, 1984: Spot 1 month 3 month 6 month 12 month U. S. Dollar $ 1. 3568 1. 3600 1. 3659 1. 3752 1. 3940 German Mark DM 3. 7725 3. 7620 3. 7394 3. 7047 3. 6438 Japanese Yen 322.0 321.2 319. 4 316.5 310.2 INTEREST RATES, Domestic Domestic END OF JUNE 1984: Gov't Corporate Domestic Bonds Bonds Treasury Money (long-term) Bills Market U. S. $ 13 . 75% 14.50% 10 .29% 11 . 63% Germany DM 8. 258 8. 00% #N/A 6 . 10% U . K. E 10. 818 12 . 69% 9. 08% 9. 44% Japan 7. 46% 7. 13% 4. 918 6. 40%\f
Step by Step Solution
There are 3 Steps involved in it
1 Expert Approved Answer
Step: 1 Unlock
Question Has Been Solved by an Expert!
Get step-by-step solutions from verified subject matter experts
Step: 2 Unlock
Step: 3 Unlock
Students Have Also Explored These Related Finance Questions!