

Question: Need Help with problem a to d pls. You work for a large investment management firm. The analysts with your firm have made the following
Need Help with problem a to d pls.
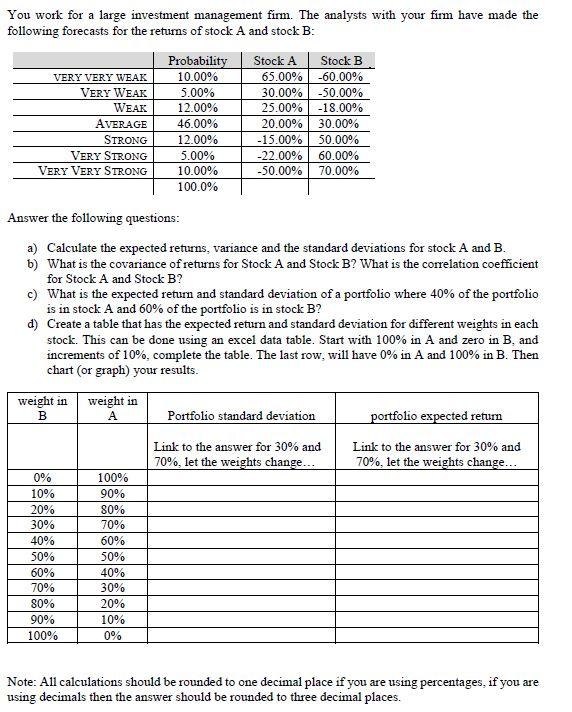
You work for a large investment management firm. The analysts with your firm have made the following forecasts for the returns of stock A and stock B: Probability Stock A Stock B VERY VERY WEAK 10.00% 65.00% -60.00% VERY WEAK 5.00% 30.00% -50.00% WEAK 12.00% 25.00% -18.00% AVERAGE 46.00% 20.00% 30.00% STRONG 12.00% -15.00% 50.00% VERY STRONG 5.00% -22.00% 60.00% VERY VERY STRONG 10.00% -50.00% 70.00% 100.0% Answer the following questions: a) Calculate the expected returns, variance and the standard deviations for stock A and B. b) What is the covariance of returns for Stock A and Stock B? What is the correlation coefficient for Stock A and Stock B? c) What is the expected return and standard deviation of a portfolio where 40% of the portfolio is in stock A and 60% of the portfolio is in stock B? d) Create a table that has the expected return and standard deviation for different weights in each stock. This can be done using an excel data table. Start with 100% in A and zero in B, and increments of 10%, complete the table. The last row, will have 0% in A and 100% in B. Then chart (or graph) your results. weight in B weight in A Portfolio standard deviation portfolio expected return Link to the answer for 30% and 70%, let the weights change... Link to the answer for 30% and 70%, let the weights change... 0% 10% 20% 30% 40% 50% 60% 70% 80% 90% 100% 100% 90% 80% 70% 60% 50% 40% 30% 20% 10% 0% Note: All calculations should be rounded to one decimal place if you are using percentages, if you are using decimals then the answer should be rounded to three decimal places. You work for a large investment management firm. The analysts with your firm have made the following forecasts for the returns of stock A and stock B: Probability Stock A Stock B VERY VERY WEAK 10.00% 65.00% -60.00% VERY WEAK 5.00% 30.00% -50.00% WEAK 12.00% 25.00% -18.00% AVERAGE 46.00% 20.00% 30.00% STRONG 12.00% -15.00% 50.00% VERY STRONG 5.00% -22.00% 60.00% VERY VERY STRONG 10.00% -50.00% 70.00% 100.0% Answer the following questions: a) Calculate the expected returns, variance and the standard deviations for stock A and B. b) What is the covariance of returns for Stock A and Stock B? What is the correlation coefficient for Stock A and Stock B? c) What is the expected return and standard deviation of a portfolio where 40% of the portfolio is in stock A and 60% of the portfolio is in stock B? d) Create a table that has the expected return and standard deviation for different weights in each stock. This can be done using an excel data table. Start with 100% in A and zero in B, and increments of 10%, complete the table. The last row, will have 0% in A and 100% in B. Then chart (or graph) your results. weight in B weight in A Portfolio standard deviation portfolio expected return Link to the answer for 30% and 70%, let the weights change... Link to the answer for 30% and 70%, let the weights change... 0% 10% 20% 30% 40% 50% 60% 70% 80% 90% 100% 100% 90% 80% 70% 60% 50% 40% 30% 20% 10% 0% Note: All calculations should be rounded to one decimal place if you are using percentages, if you are using decimals then the answer should be rounded to three decimal places
Step by Step Solution
There are 3 Steps involved in it

Get step-by-step solutions from verified subject matter experts