

Question: need help with questions 1-4 i actually need help with 1-9 and i included the data. THE REAL ESTATE SALES PRICE CASE A real estate
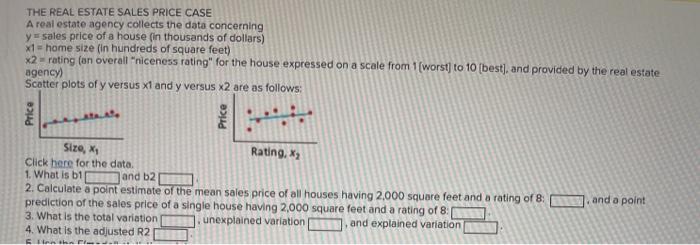
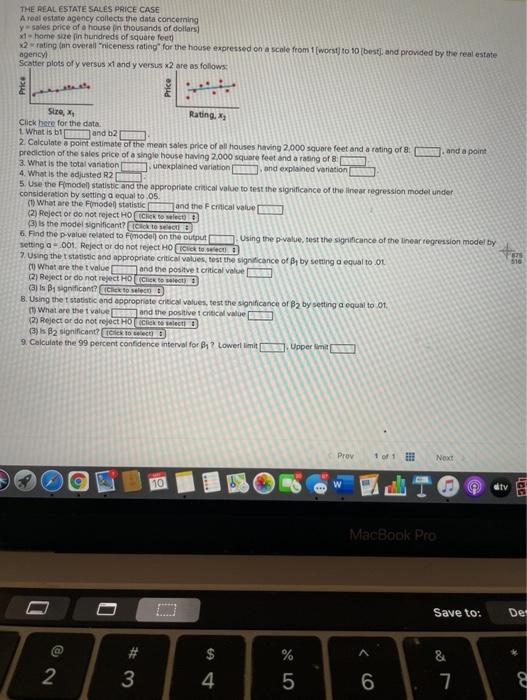
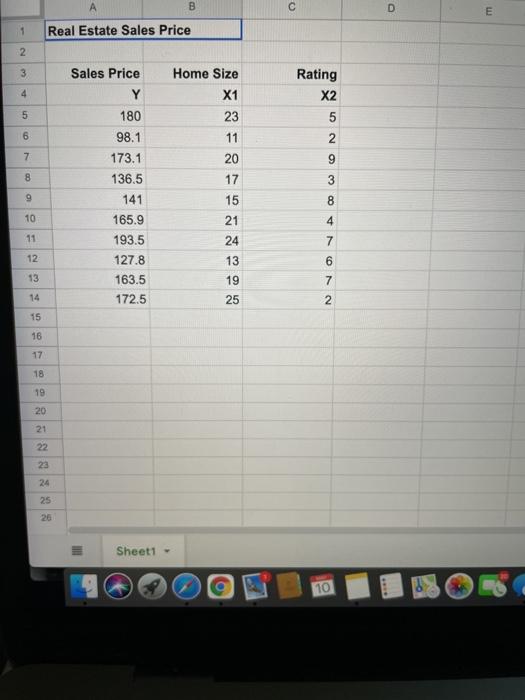
THE REAL ESTATE SALES PRICE CASE A real estate agency collects the data concerning y = sales price of a house (in thousands of dollars) *1 = home size (in hundreds of square feet) x2-rating an overall "niceness rating" for the house expressed on a scale from 1(worst) to 10 (best), and provided by the real estate agency) Scatter plots of y versus x1 and y versus x2 are as follows: Price Price Size Rating, *; Click here for the data 1. What is b1 and b2 2. Calculate a point estimate of the mean sales price of all houses having 2,000 square feet and a rating of 8: and a point prediction of the sales price of a single house having 2,000 square feet and a rating of 8. 3. What is the total variation unexplained variation and explained variation 4. What is the adjusted R2 THE REAL ESTATE SALES PRICE CASE A real estate agency collects the data concerning y sales price of a house in thousands of dollars) dhome size in hundreds of square feet) 2 rating an overall niceness rating for the house expressed on a scale from 1(worst to 10 best, and provided by the real estate agericyl Scatter plots of y versus xl and y versus x2 are as follows: PTICE Price Siro, Rating, Click here for the data 1 What is band b2 2. Calculate a point estimate of the mean soles price of all houses having 2.000 square feet and a rating of and a point prediction of the sales price of a single house having 2,000 square feet and a rating of 8 3. What is the total variation unexplained variation and explained variation 4. What is the adjusted R2 5. Use the model) statistic and the appropriate critical value to test the significance of the linear regression model under consideration by setting a equal to 05. (1) What are the model statistic and the critical value (2) Reject or do not reject HOC to select D 3) is the model significant? Co to B 6. Find the p-value related to Fimodell on the output Using the value, test the significance of the linear regression model by setting a - 001. Reject or do not reject HOIClick to select 7. Using the statistic and appropriate critical values, test the significance of By by setting a equal to ou (0) What are the t value and the positve t critical value (2) Reject or do not reject HD Click to select (3) Is B significant? Click to see B. Using the statistic and appropriate critical values, test the significance of B2 by setting a equal to 1 1) What are the value and the positive t critical value (23) Reject or do not reject Holick to select 3 (3) is B2 significant les 10 colect 9. Calculate the 99 percent confidence interval for Ba? Lower limitsUpper im 510 Prov 1 of 1 F Next 10 8 ktv LCC MacBook Pro Save to: Det $ % 2 # 3 & 7 4 5 6 8 B c E 1 Real Estate Sales Price 2 3 4 Rating X2 5 5 5 Sales Price Y 180 98.1 173.1 136.5 6 2 7 9 Home Size X1 23 11 20 17 15 21 24 13 8 3 9 141 8 10 4 11 7 12 165.9 193.5 127.8 163.5 172.5 13 19 NO 14 25 15 16 17 18 19 20 21 23 24 25 26 Sheet1 - 10 THE REAL ESTATE SALES PRICE CASE A real estate agency collects the data concerning y = sales price of a house (in thousands of dollars) *1 = home size (in hundreds of square feet) x2-rating an overall "niceness rating" for the house expressed on a scale from 1(worst) to 10 (best), and provided by the real estate agency) Scatter plots of y versus x1 and y versus x2 are as follows: Price Price Size Rating, *; Click here for the data 1. What is b1 and b2 2. Calculate a point estimate of the mean sales price of all houses having 2,000 square feet and a rating of 8: and a point prediction of the sales price of a single house having 2,000 square feet and a rating of 8. 3. What is the total variation unexplained variation and explained variation 4. What is the adjusted R2 THE REAL ESTATE SALES PRICE CASE A real estate agency collects the data concerning y sales price of a house in thousands of dollars) dhome size in hundreds of square feet) 2 rating an overall niceness rating for the house expressed on a scale from 1(worst to 10 best, and provided by the real estate agericyl Scatter plots of y versus xl and y versus x2 are as follows: PTICE Price Siro, Rating, Click here for the data 1 What is band b2 2. Calculate a point estimate of the mean soles price of all houses having 2.000 square feet and a rating of and a point prediction of the sales price of a single house having 2,000 square feet and a rating of 8 3. What is the total variation unexplained variation and explained variation 4. What is the adjusted R2 5. Use the model) statistic and the appropriate critical value to test the significance of the linear regression model under consideration by setting a equal to 05. (1) What are the model statistic and the critical value (2) Reject or do not reject HOC to select D 3) is the model significant? Co to B 6. Find the p-value related to Fimodell on the output Using the value, test the significance of the linear regression model by setting a - 001. Reject or do not reject HOIClick to select 7. Using the statistic and appropriate critical values, test the significance of By by setting a equal to ou (0) What are the t value and the positve t critical value (2) Reject or do not reject HD Click to select (3) Is B significant? Click to see B. Using the statistic and appropriate critical values, test the significance of B2 by setting a equal to 1 1) What are the value and the positive t critical value (23) Reject or do not reject Holick to select 3 (3) is B2 significant les 10 colect 9. Calculate the 99 percent confidence interval for Ba? Lower limitsUpper im 510 Prov 1 of 1 F Next 10 8 ktv LCC MacBook Pro Save to: Det $ % 2 # 3 & 7 4 5 6 8 B c E 1 Real Estate Sales Price 2 3 4 Rating X2 5 5 5 Sales Price Y 180 98.1 173.1 136.5 6 2 7 9 Home Size X1 23 11 20 17 15 21 24 13 8 3 9 141 8 10 4 11 7 12 165.9 193.5 127.8 163.5 172.5 13 19 NO 14 25 15 16 17 18 19 20 21 23 24 25 26 Sheet1 - 10
Step by Step Solution
There are 3 Steps involved in it

Get step-by-step solutions from verified subject matter experts