

Question: need help with requirement 1e please Comparative financial statement data of Canfield, Inc. follow: (Click the icon to view the income statement.) (Click the icon
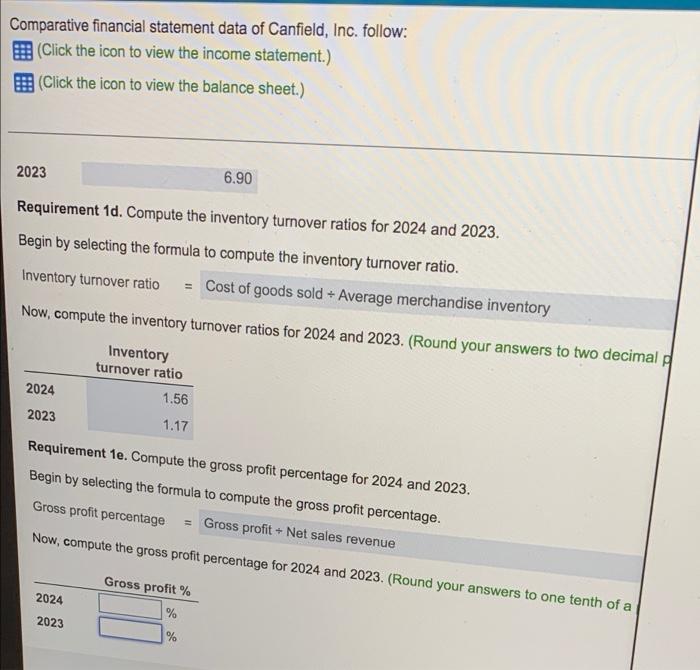
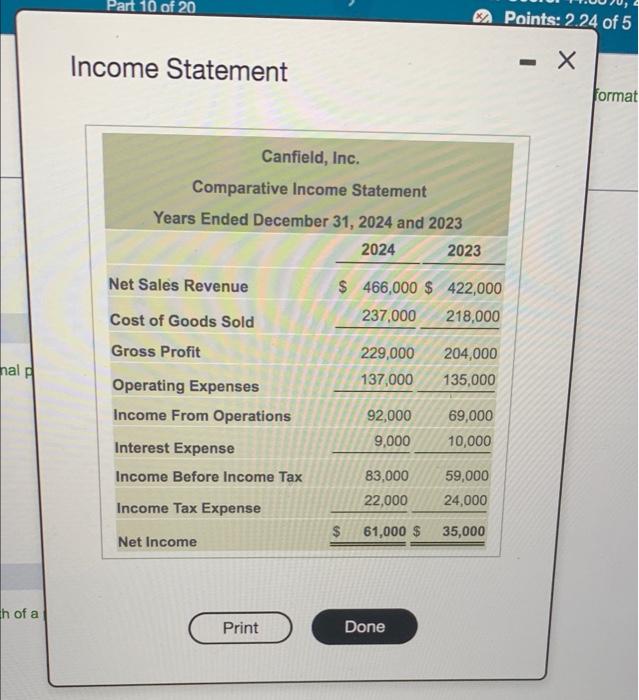
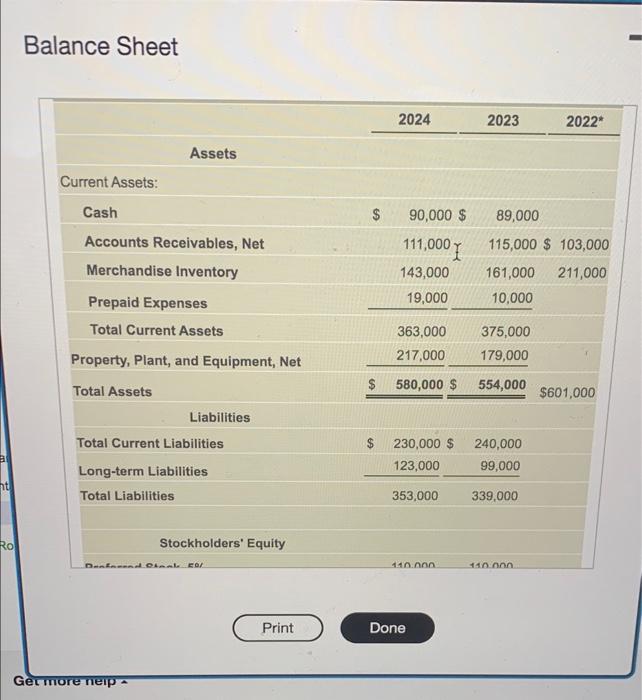
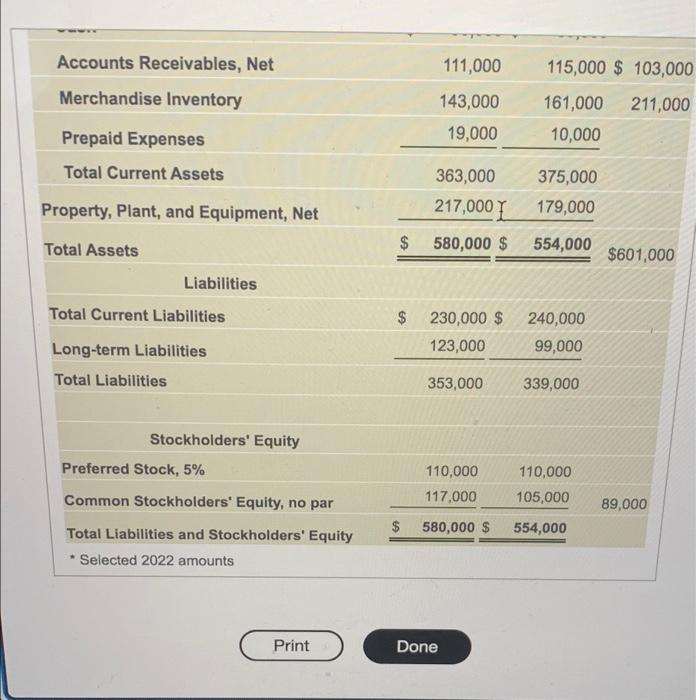
Comparative financial statement data of Canfield, Inc. follow: (Click the icon to view the income statement.) (Click the icon to view the balance sheet.) 6.90 2023 Requirement 1d. Compute the inventory turnover ratios for 2024 and 2023. Begin by selecting the formula to compute the inventory turnover ratio. Inventory turnover ratio = Cost of goods sold + Average merchandise inventory Now, compute the inventory turnover ratios for 2024 and 2023. (Round your answers to two decimal p Inventory turnover ratio 2024 1.56 2023 1.17 Requirement 1e. Compute the gross profit percentage for 2024 and 2023. Begin by selecting the formula to compute the gross profit percentage. Gross profit percentage = Gross profit+ Net sales revenue Now, compute the gross profit percentage for 2024 and 2023. (Round your answers to one tenth of a Gross profit % 2024 % 2023 % hal p h of a Part 10 of 20 Income Statement Canfield, Inc. Comparative Income Statement Years Ended December 31, 2024 and 2023 2024 2023 $ 466,000 $ 422,000 237,000 218,000 229,000 204,000 137,000 135,000 92,000 69,000 9,000 10,000 83,000 59,000 22,000 24,000 $ 61,000 $ 35,000 Done Net Sales Revenue Cost of Goods Sold Gross Profit Operating Expenses Income From Operations Interest Expense Income Before Income Tax Income Tax Expense Net Income Print Points: 2.24 of 5 format B ht Ro Balance Sheet Assets Current Assets: Cash Accounts Receivables, Net Merchandise Inventory Prepaid Expenses Total Current Assets Property, Plant, and Equipment, Net Total Assets Liabilities Total Current Liabilities Long-term Liabilities Total Liabilities Denfocend Obnak EO/ Get more neip Stockholders' Equity Print $ 2024 2022* 89,000 90,000 $ 111,000 115,000 $ 103,000 143,000 161,000 211,000 19,000 10,000 363,000 375,000 217,000 179,000 580,000 $ 554,000 $601,000 230,000 $ 240,000 123,000 99,000 353,000 339,000 110.000 110.000. Done 2023 Accounts Receivables, Net Merchandise Inventory Prepaid Expenses Total Current Assets Property, Plant, and Equipment, Net Total Assets Liabilities Total Current Liabilities Long-term Liabilities Total Liabilities Stockholders' Equity Preferred Stock, 5% Common Stockholders' Equity, no par Total Liabilities and Stockholders' Equity Selected 2022 amounts Print $ 111,000 115,000 $103,000 143,000 161,000 211,000 19,000 10,000 363,000 375,000 217,000 179,000 580,000 $ 554,000 $601,000 230,000 $ 240,000 123,000 99,000 353,000 339,000 110,000 110,000 117,000 105,000 580,000 $ 554,000 Done 89,000
Step by Step Solution
There are 3 Steps involved in it

Get step-by-step solutions from verified subject matter experts