

Question: need help with requirement 1f please Comparative financial statement data of Canfield, Inc. follow: (Click the icon to view the income statement.) (Click the icon
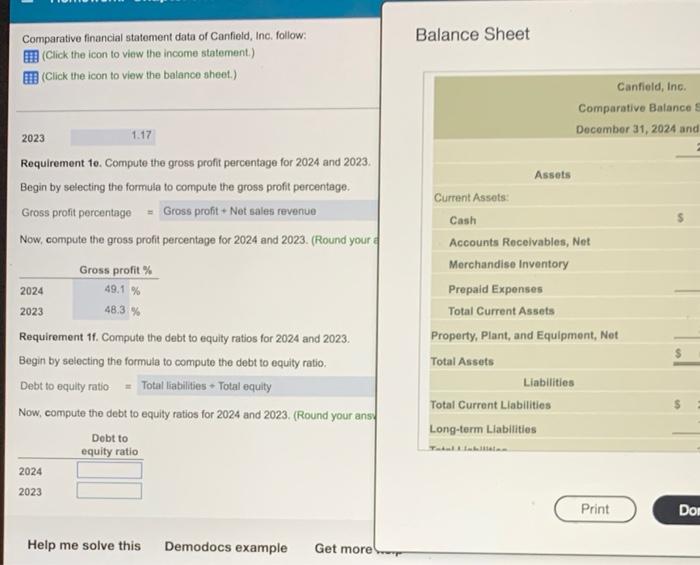
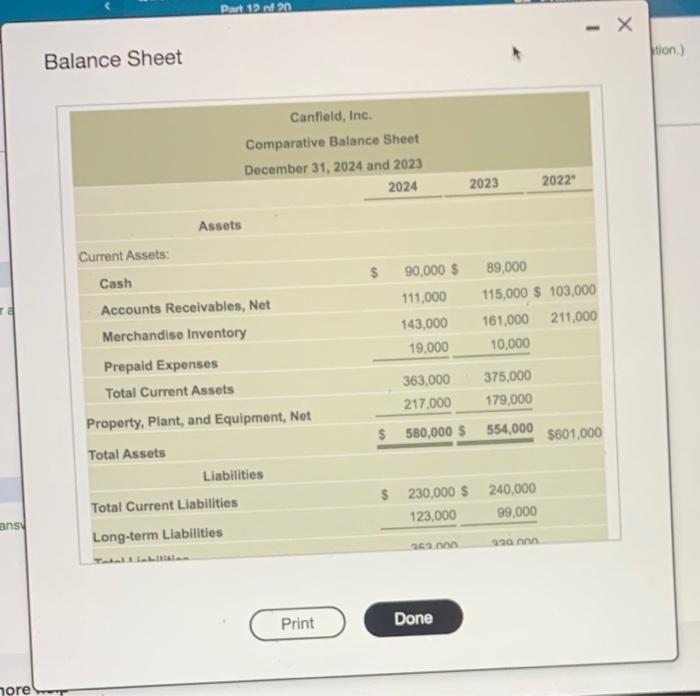
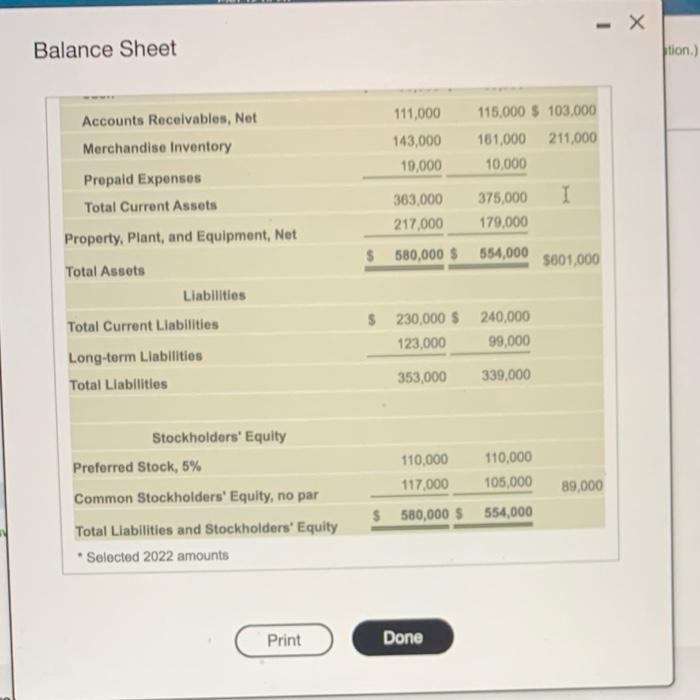
Comparative financial statement data of Canfield, Inc. follow: (Click the icon to view the income statement.) (Click the icon to view the balance sheet.) 1.17 2023 Requirement 1e. Compute the gross profit percentage for 2024 and 2023. Begin by selecting the formula to compute the gross profit percentage. Gross profit+ Net sales revenue Gross profit percentage Now, compute the gross profit percentage for 2024 and 2023. (Round your a Gross profit % 2024 49.1% 2023 48.3 % Requirement 11. Compute the debt to equity ratios for 2024 and 2023. Begin by selecting the formula to compute the debt to equity ratio. Debt to equity ratio Total liabilities - Total equity Now, compute the debt to equity ratios for 2024 and 2023. (Round your ans Debt to equity ratio 2024 2023 Help me solve this Demodocs example Get more Balance Sheet Assets Current Assets: Cash Accounts Receivables, Net Merchandise Inventory Prepaid Expenses Total Current Assets Property, Plant, and Equipment, Net Total Assets Liabilities Total Current Liabilities Long-term Liabilities Canfield, Inc. Comparative Balance S December 31, 2024 and Print Dom ra ans horel Part 12 of 20 Balance Sheet Assets Current Assets: Cash Accounts Receivables, Net Merchandise Inventory Prepaid Expenses Total Current Assets Property, Plant, and Equipment, Net Total Assets Liabilities Total Current Liabilities Long-term Liabilities Tatal & Inhallision Canfield, Inc. Comparative Balance Sheet December 31, 2024 and 2023 2024 Print 90,000 $ 111,000 143,000 19,000 363,000 217,000 $ 580,000 $ $ 230,000 $ 123,000 363.000 Done 1 2023 2022" 89,000 115,000 $103,000 161,000 211,000 10,000 375,000 179,000 554,000 $601,000 240,000 99,000 330.000 X tion.) Balance Sheet Accounts Receivables, Net Merchandise Inventory Prepaid Expenses Total Current Assets Property, Plant, and Equipment, Net Total Assets Liabilities Total Current Liabilities Long-term Liabilities Total Liabilities Stockholders' Equity Preferred Stock, 5% Common Stockholders' Equity, no par Total Liabilities and Stockholders' Equity Selected 2022 amounts Print 111,000 143,000 19,000 363,000 217,000 580,000 $ $ 230,000 $ 123,000 353,000 110,000 117,000 $ 580,000 $ Done 115,000 $ 103,000 161,000 211,000 10,000 375,000 I 179,000 554,000 240,000 99,000 339,000 110,000 105,000 554,000 $601,000 89,000 tion.)
Step by Step Solution
There are 3 Steps involved in it

Get step-by-step solutions from verified subject matter experts