

Question: need help with requirements 1 & 2 please! Data for Mariner Designs, Inc. follow: (Click the icon to view the data.) Read the requirements. Requirement
need help with requirements 1 & 2 please!
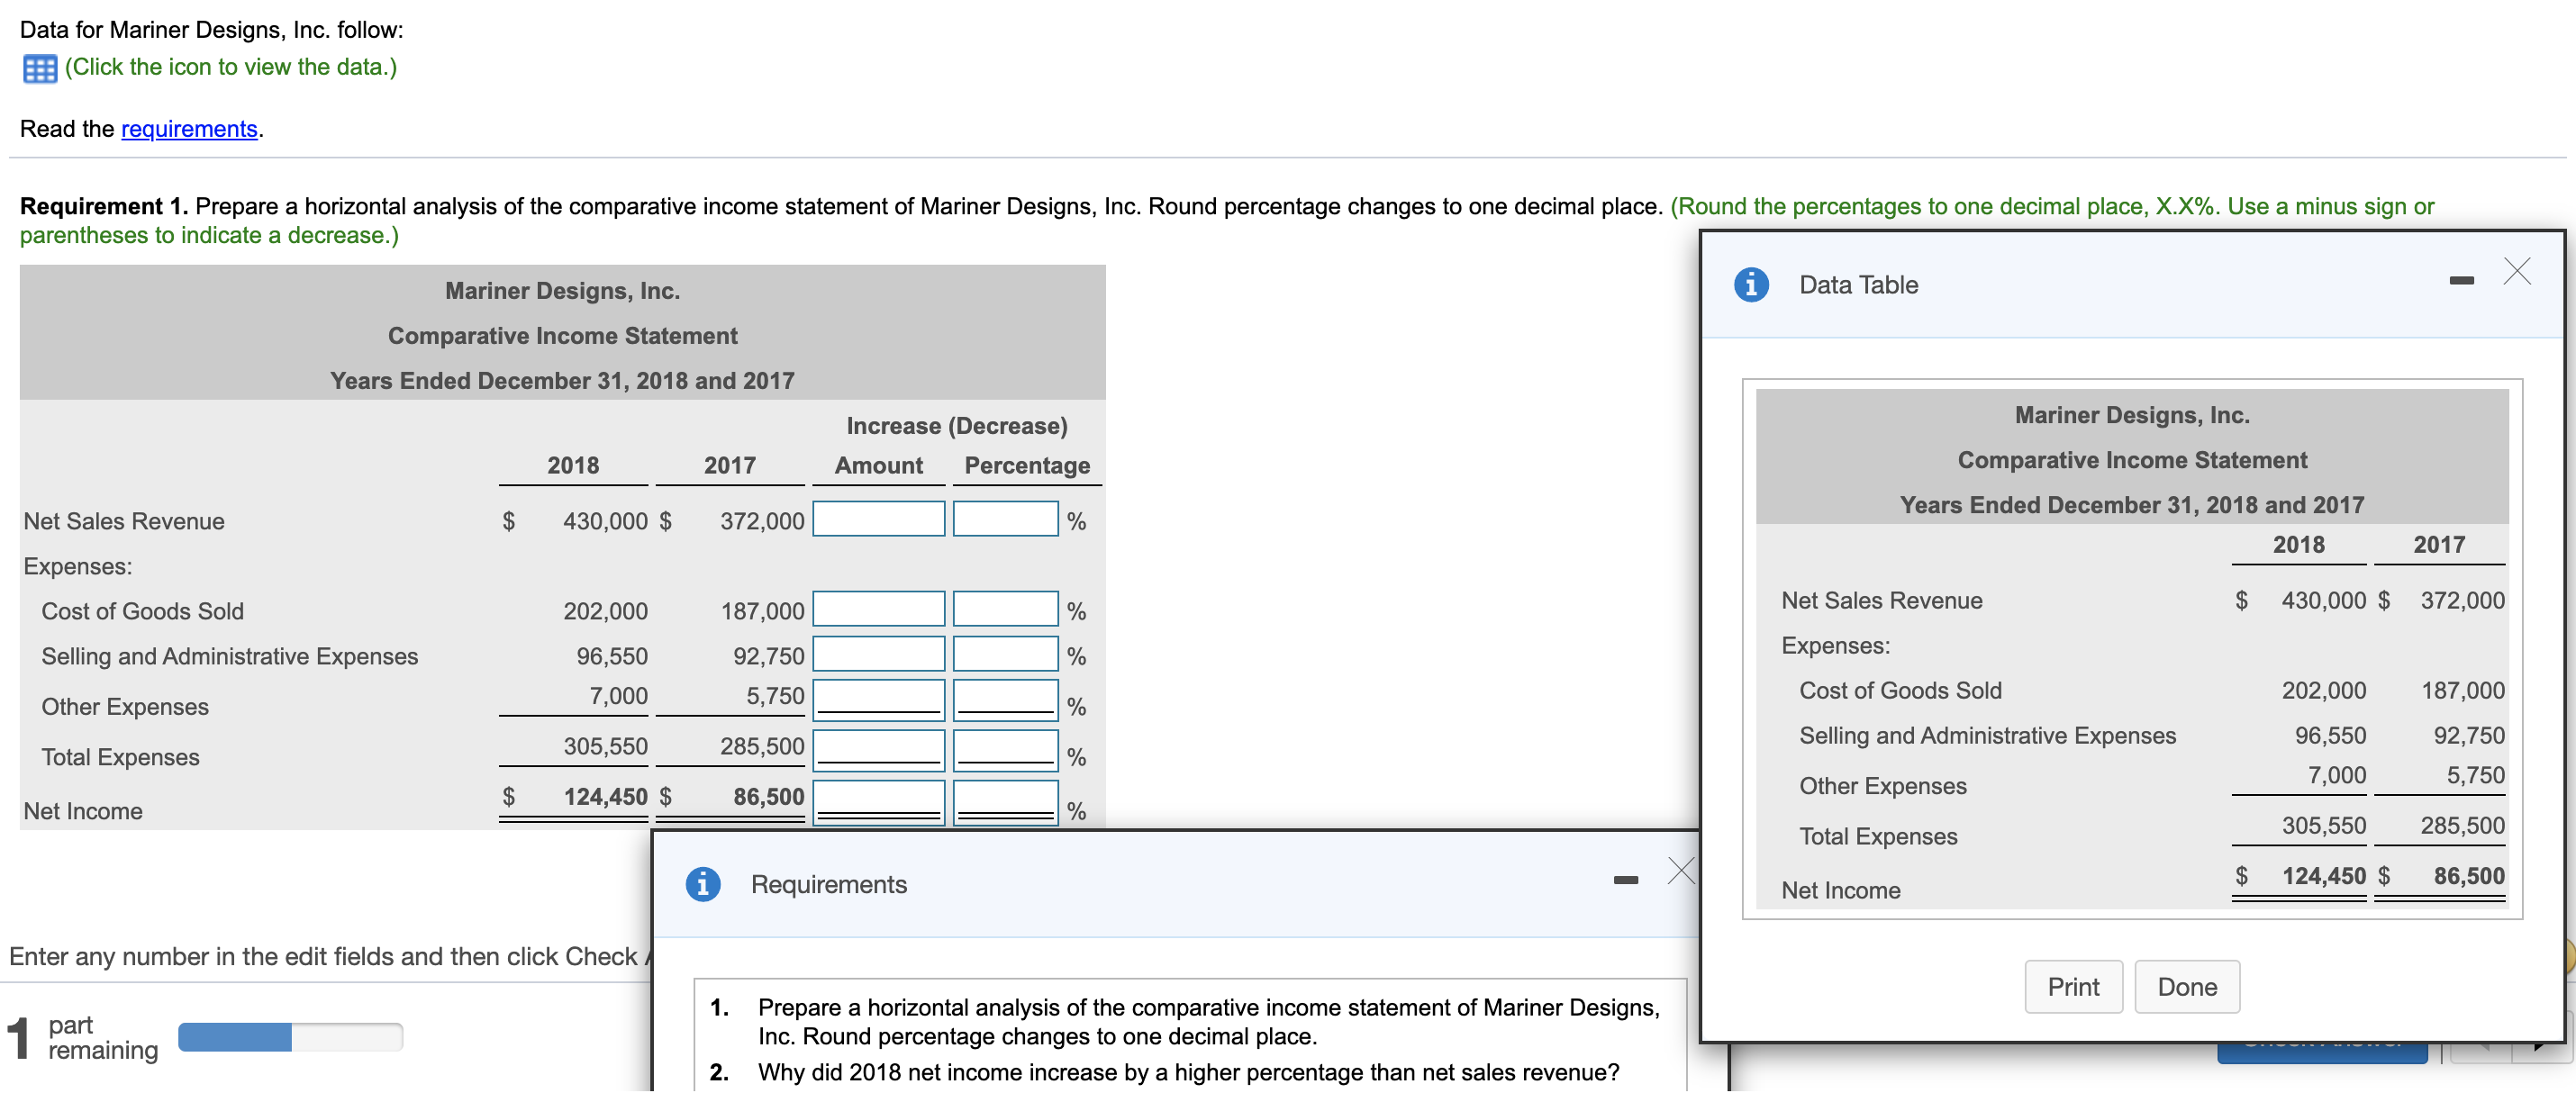
Data for Mariner Designs, Inc. follow: (Click the icon to view the data.) Read the requirements. Requirement 1. Prepare a horizontal analysis of the comparative income statement of Mariner Designs, Inc. Round percentage changes to one decimal place. (Round the percentages to one decimal place, X.X%. Use a minus sign or parentheses to indicate a decrease. Mariner Designs, Inc. i Data Table - X Comparative Income Statement Years Ended December 31, 2018 and 2017 Increase (Decrease) Mariner Designs, Inc. 2018 2017 Amount Percentage Comparative Income Statement 430,000 $ 372,000 |% Years Ended December 31, 2018 and 2017 Net Sales Revenue 2018 2017 Expenses: 202,000 187,000 Net Sales Revenue $ 430,000 $ 372,000 Cost of Goods Sold Selling and Administrative Expenses 96,550 92,750 Expenses: Cost of Goods Sold 202,000 187,000 Other Expenses 7,000 5,750 305,550 285,500 Selling and Administrative Expenses 96,550 92,750 Total Expenses Other Expenses 7,000 5,750 Net Income 124,450 $ 86,500 % Total Expenses 305,550 285,500 i Requirements Net Income $ 124,450 $ 86,500 Enter any number in the edit fields and then click Check Print Done 1. Prepare a horizontal analysis of the comparative income statement of Mariner Designs, part remaining Inc. Round percentage changes to one decimal place. 2. Why did 2018 net income increase by a higher percentage than net sales revenue
Step by Step Solution
There are 3 Steps involved in it

Get step-by-step solutions from verified subject matter experts