

Question: Need help with screenshots 1 through 7. All information needed in solving these problems can be found below. If you have any questions, please comment
Need help with screenshots 1 through 7. All information needed in solving these problems can be found below. If you have any questions, please comment below and I will get back to you immediately. Thank you!
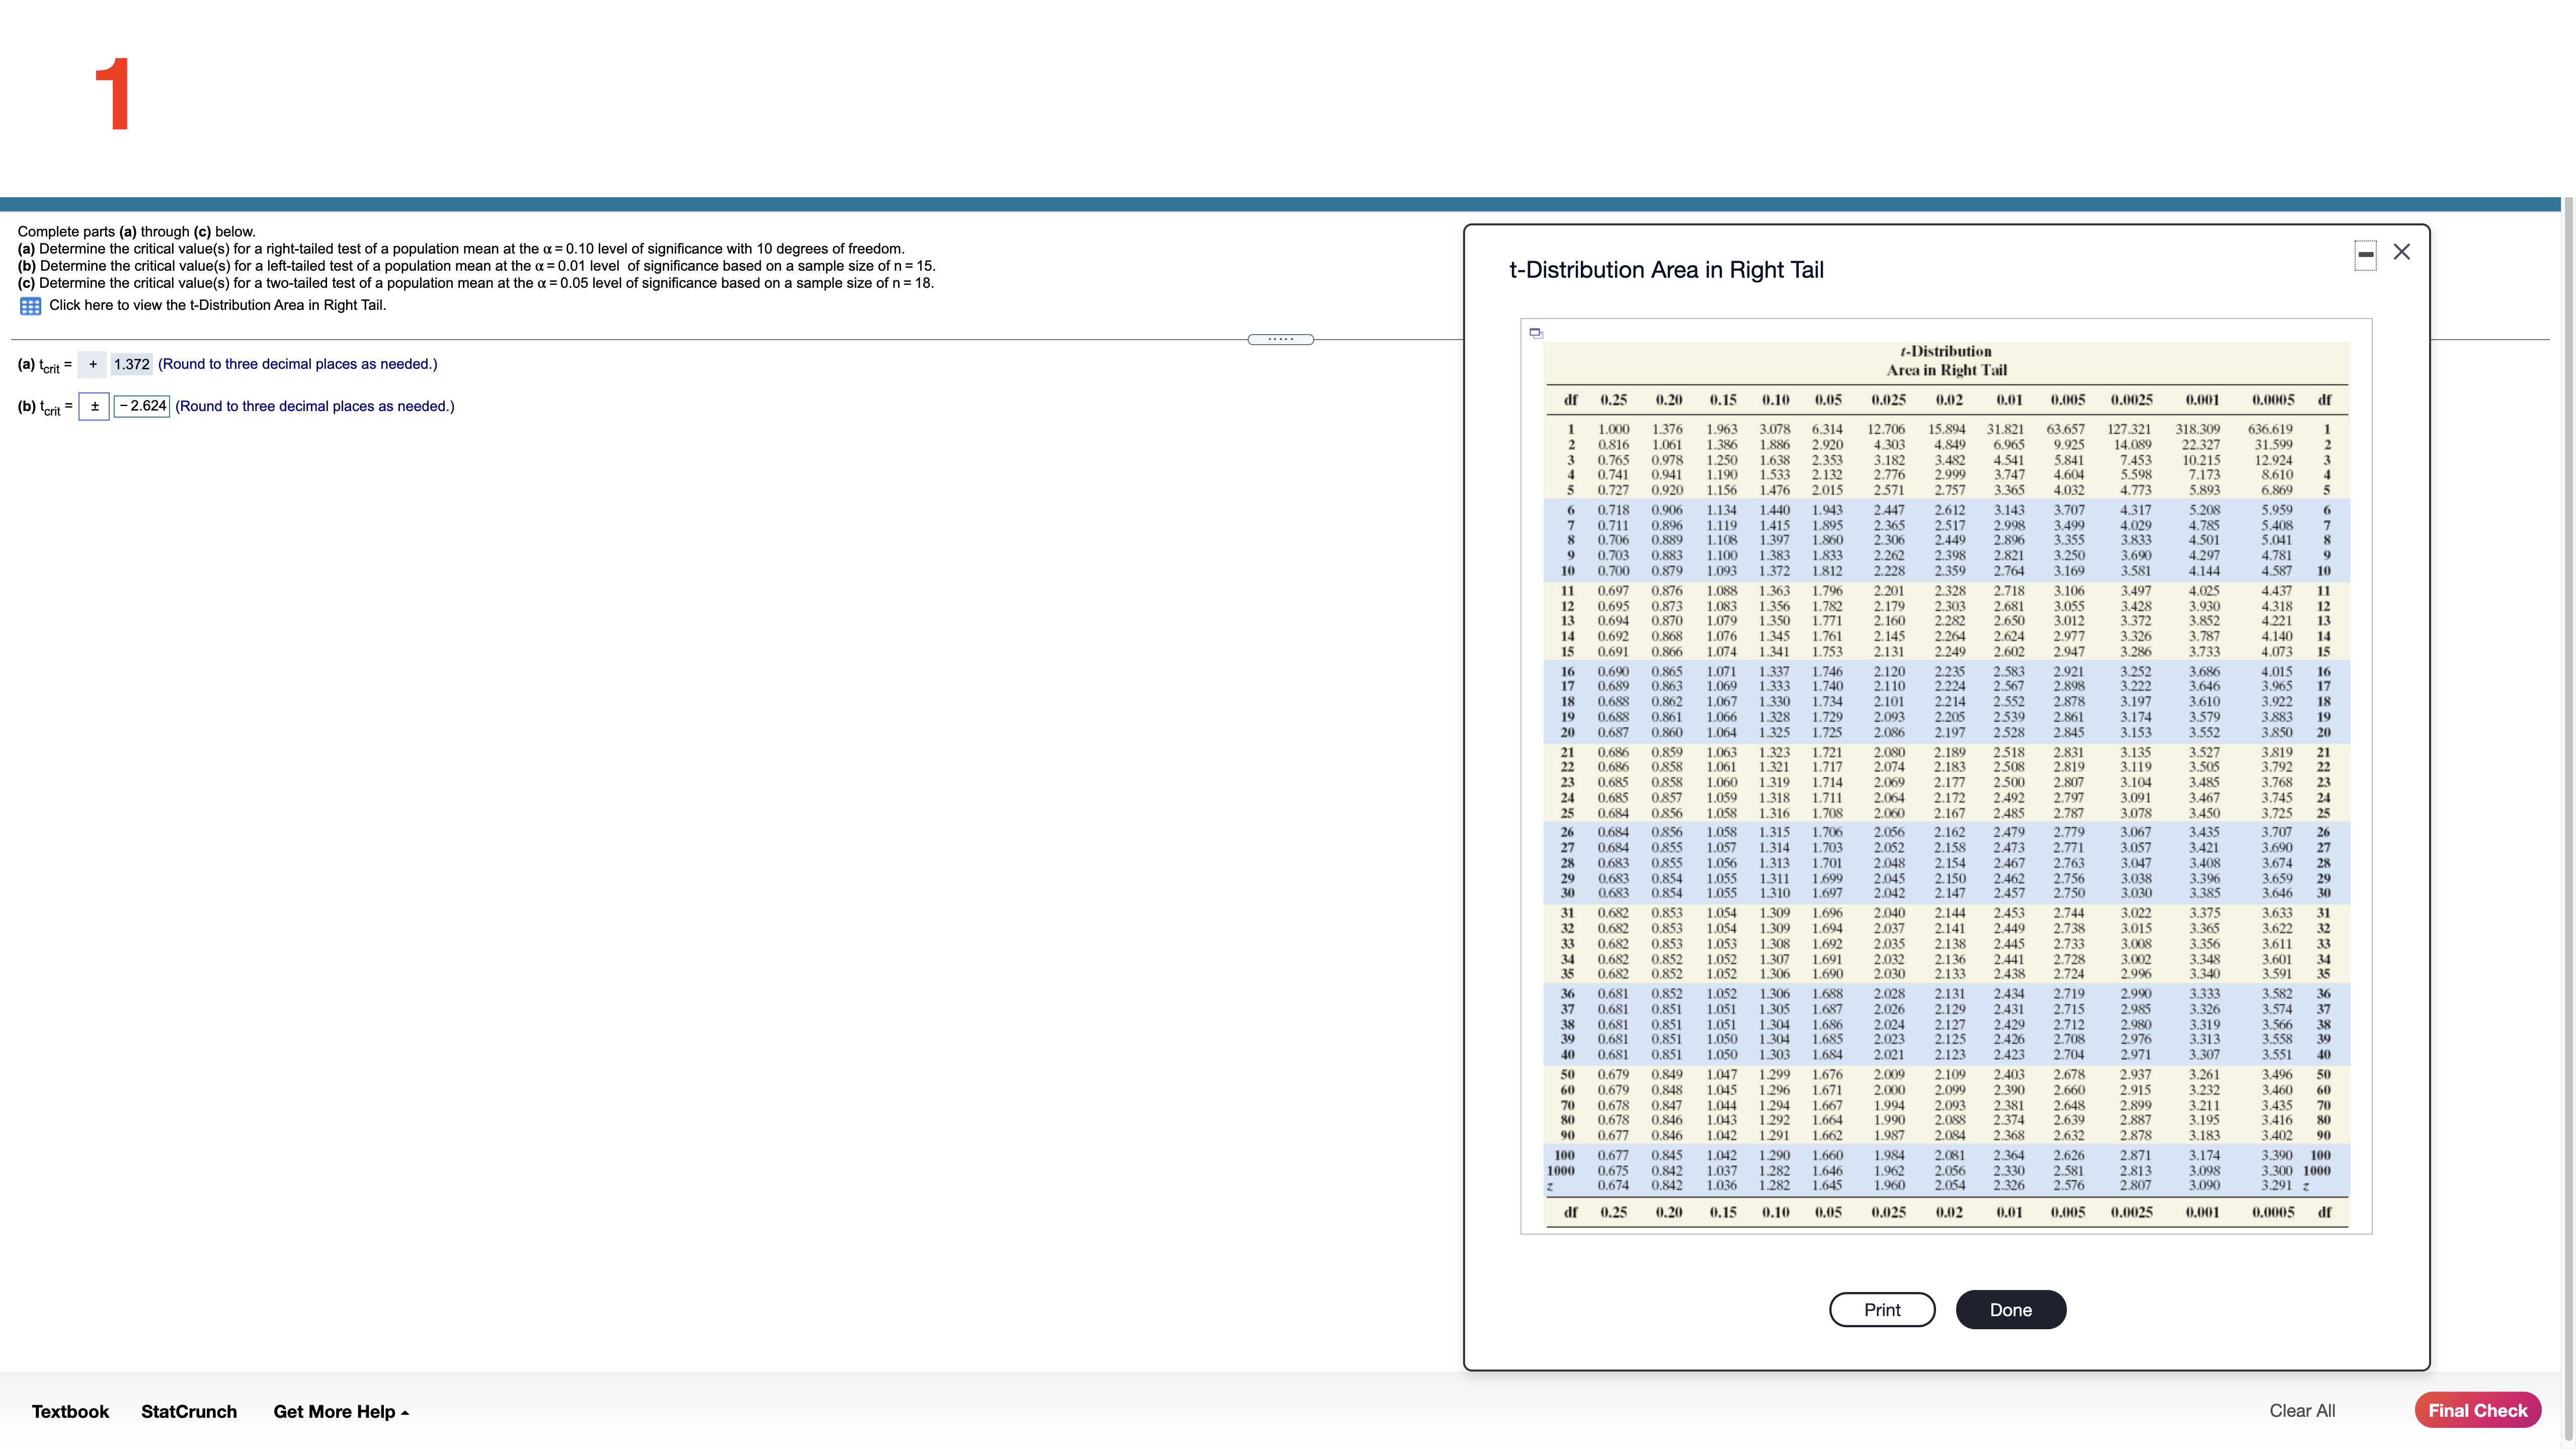
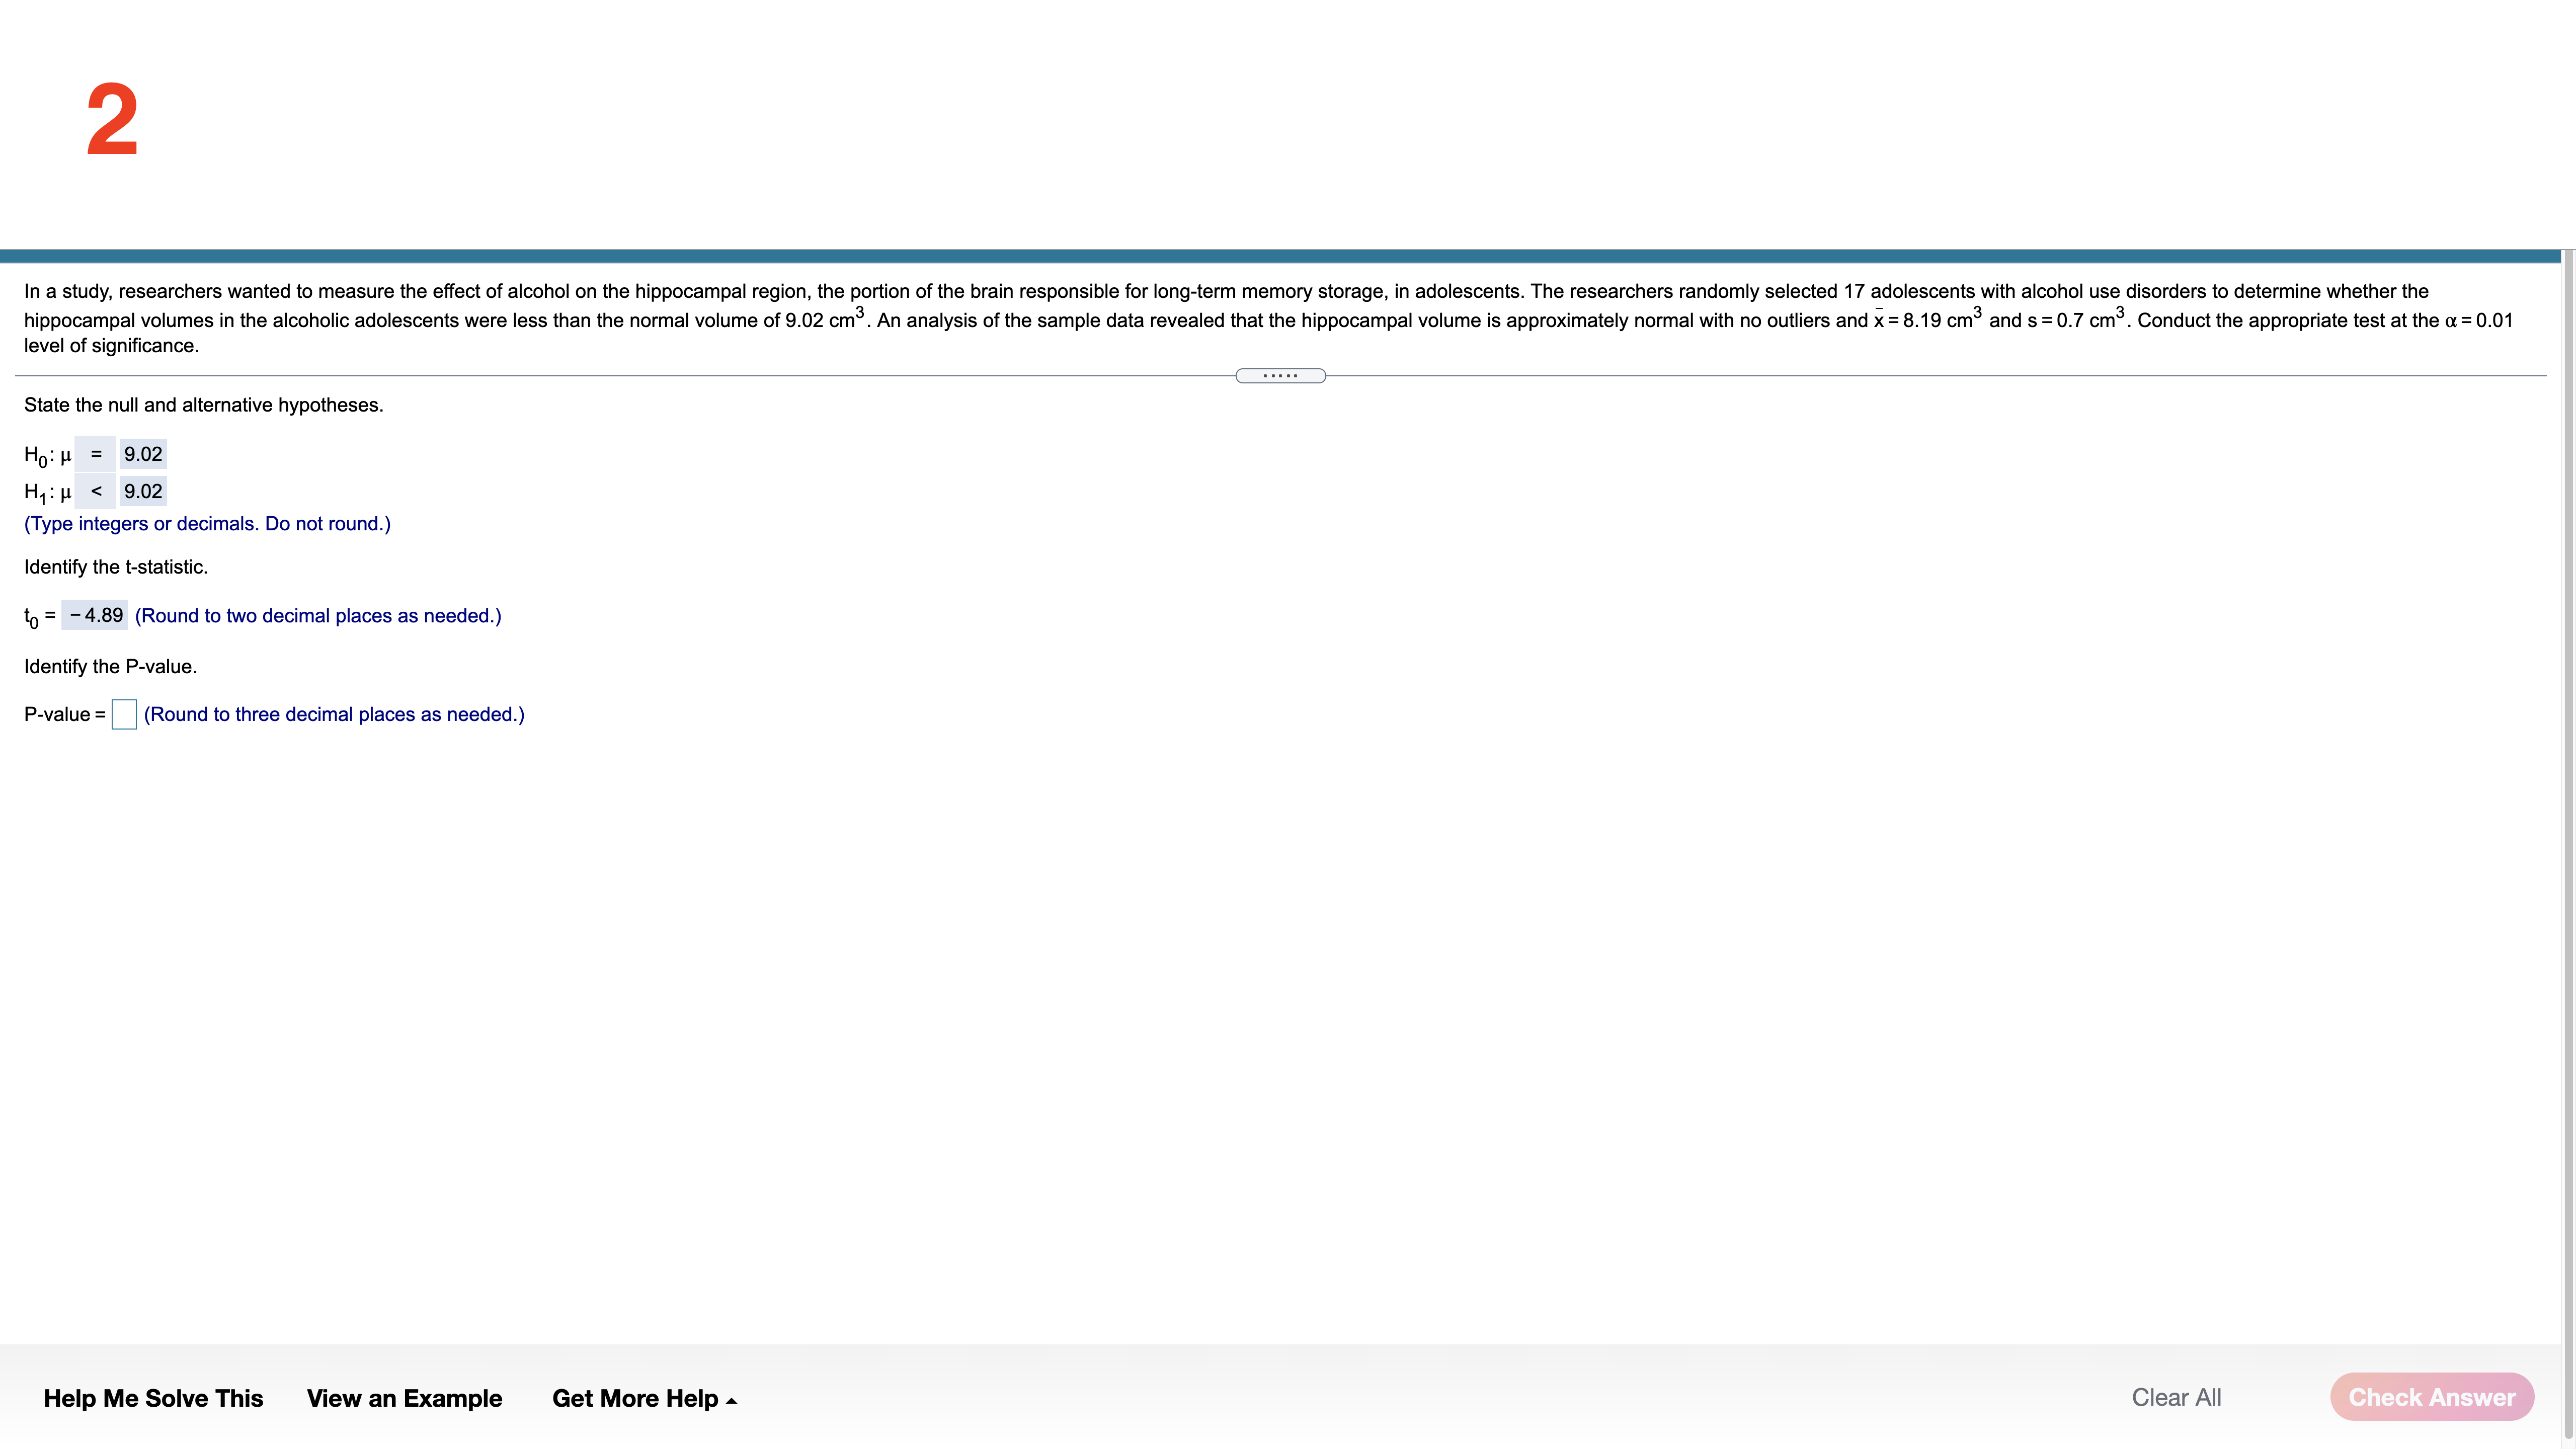
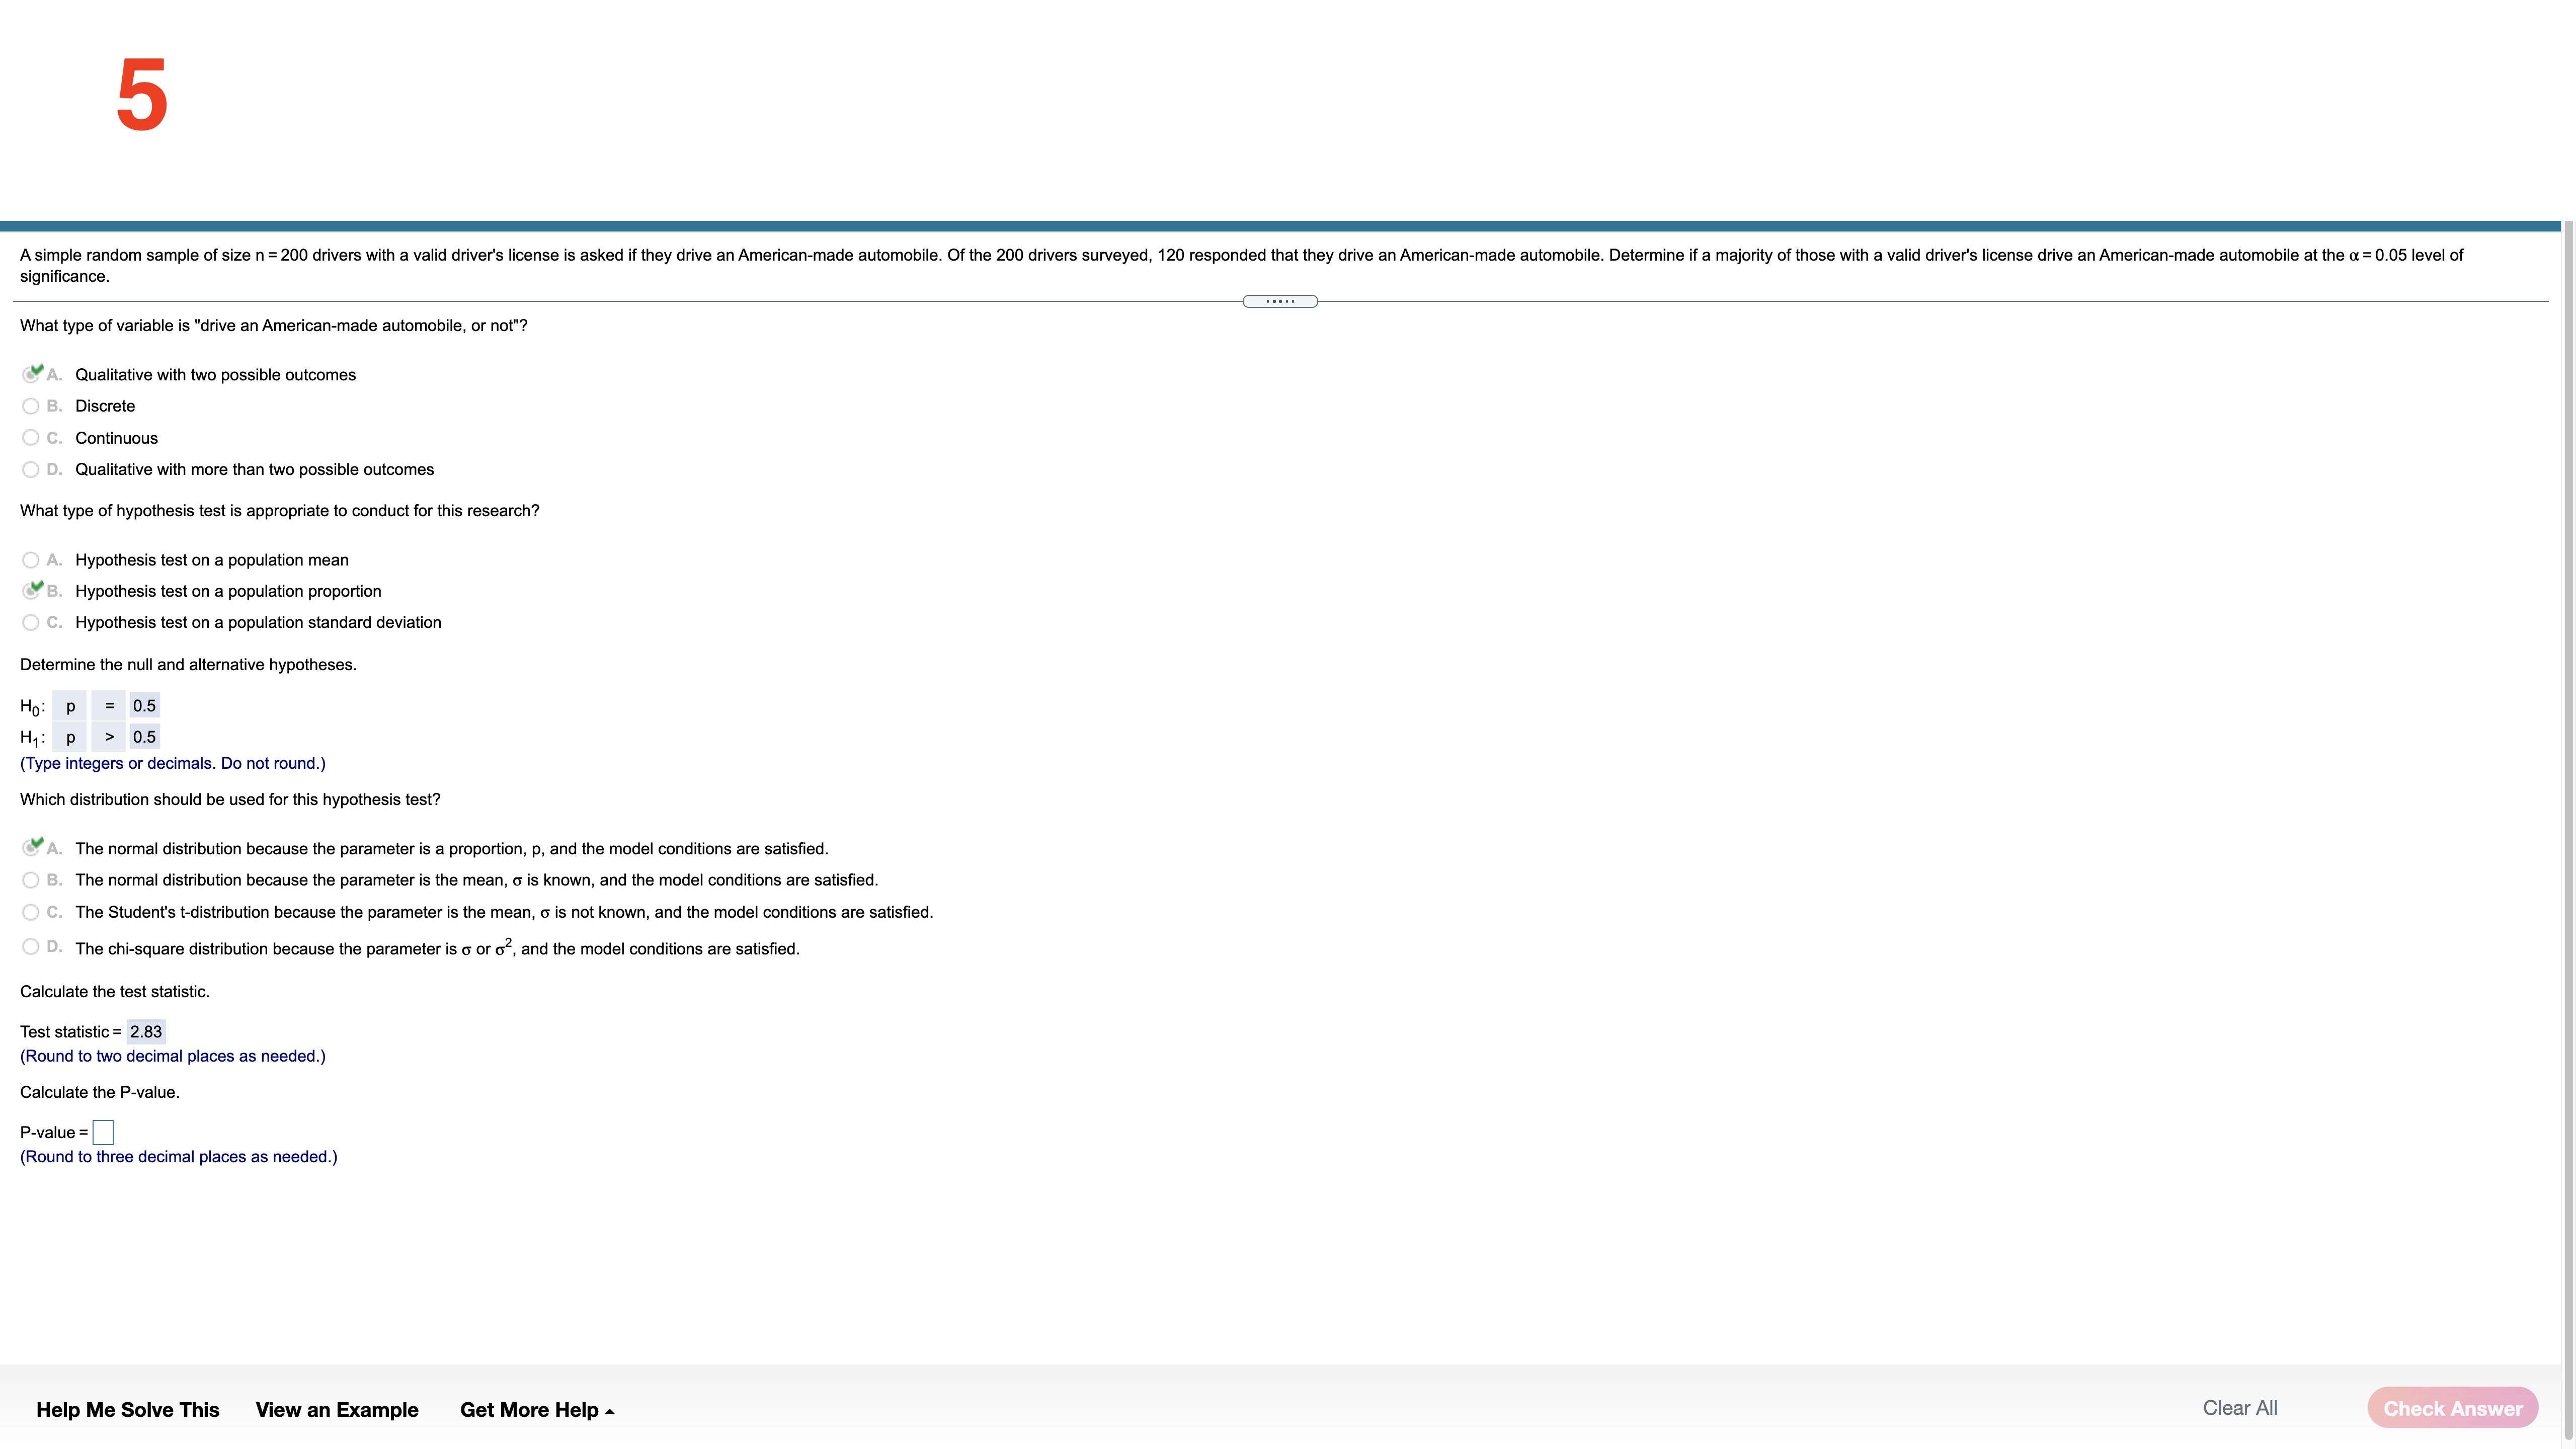
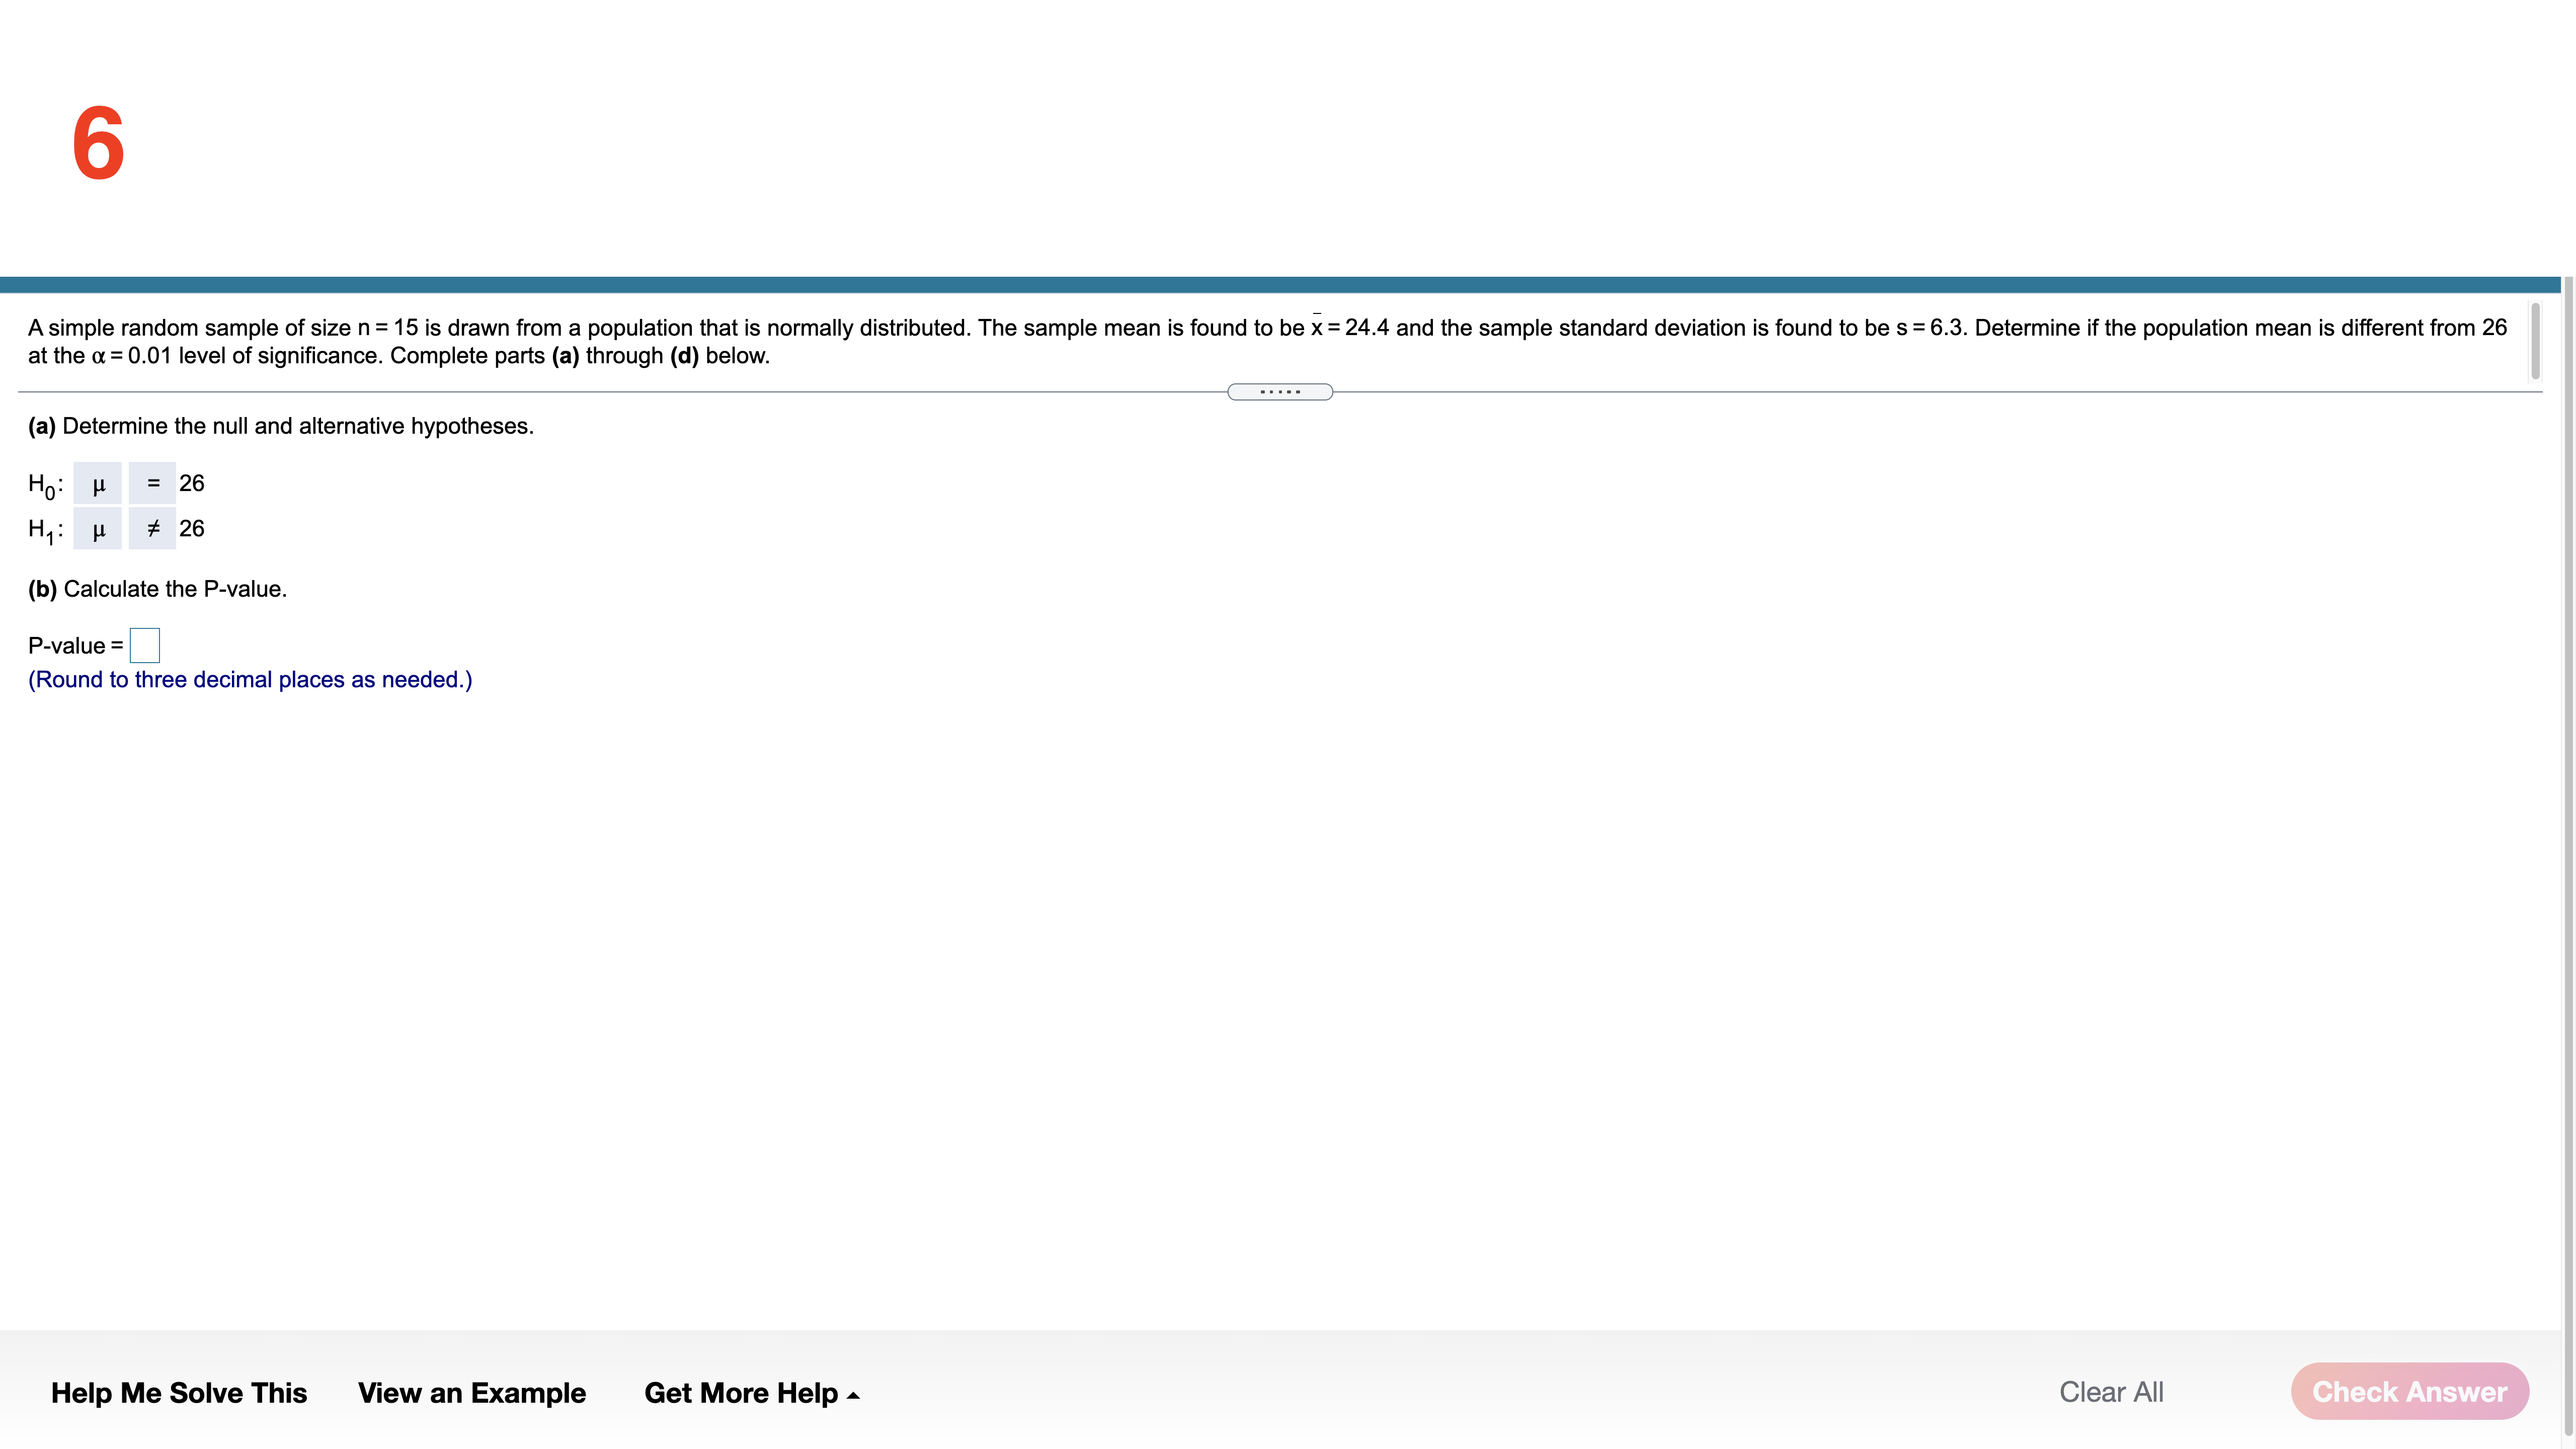
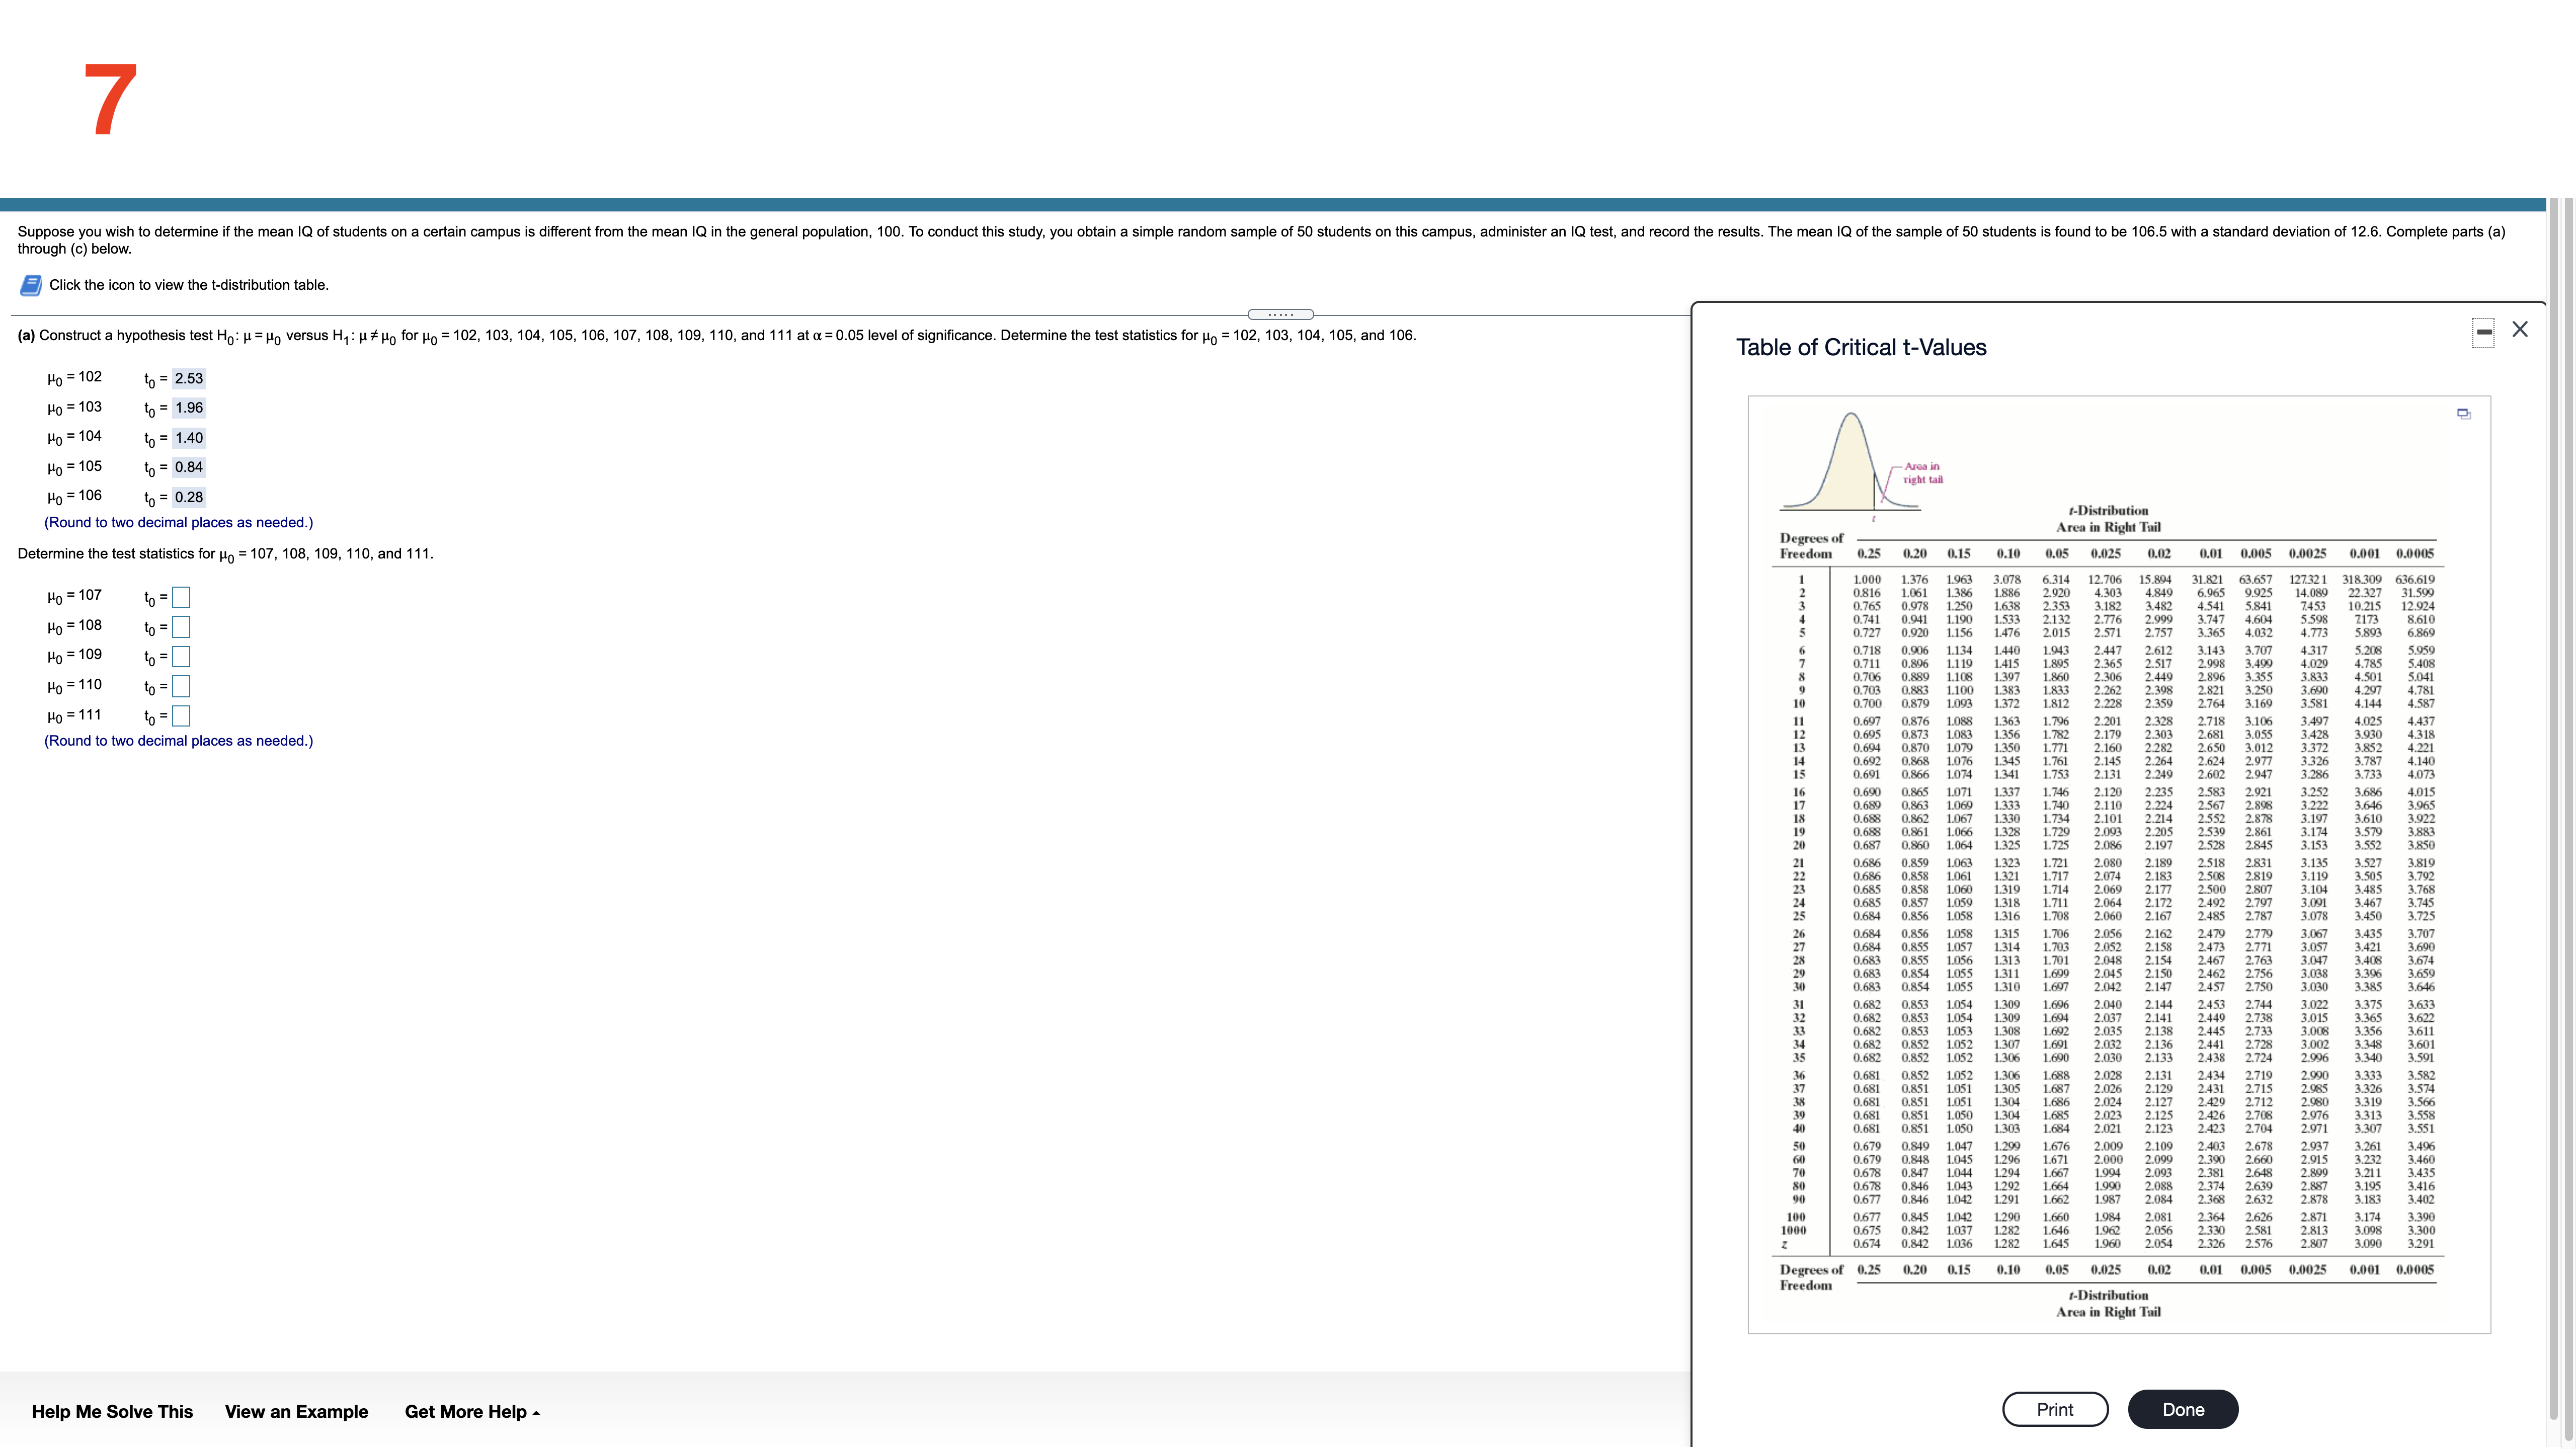
- X Complete parts (a) through (c) below. (a) Determine the critical value(s) for a right-tailed test of a population mean at the a = 0.10 level of significance with 10 degrees of freedom. (b) Determine the critical value(s) for a left-tailed test of a population mean at the a = 0.01 level of significance based on a sample size of n = 15. t-Distribution Area in Right Tail (c) Determine the critical value(s) for a two-tailed test of a population mean at the a = 0.05 level of significance based on a sample size of n = 18. Click here to view the t-Distribution Area in Right Tail. f-Distribution Area in Right Tail (a) torit = + 1.372 (Round to three decimal places as needed.) df 0.25 0.20 0.15 0.10 0.05 0.025 0.02 0.01 0.005 0.0025 0.001 0.0005 df (b) torit = + -2.624 (Round to three decimal places as needed.) 1.000 1.376 1.963 3.078 6.314 12.706 31.821 63.657 127.32 $18.309 636.619 1.386 2.920 4.303 6.965 9.925 14.089 22.32 0.816 31.599 1.250 2.353 3 182 3.482 5.841 7.453 10.21 12.924 WN 0.765 4 0.741 0.941 1.190 2132 2.776 2.990 3.747 4.604 5.598 7.173 8.610 5 0.727 0.920 1.156 1.476 2.015 2.571 2.757 3.365 4.032 4.773 5.893 6.869 0.718 1.440 3.707 4.317 5.959 6 0.906 1.134 1.943 2441 2.612 3.143 5.208 0.711 2.365 2.517 2.998 4.029 4.785 0.706 2.306 4.501 5.041 3.690 4.297 4.781 9 0.703 2.262 2.398 10 0.700 2.228 2.359 3.169 3.581 4.144 4.587 10 11 0.697 0.876 1.088 1.363 1.796 2.201 2.328 2.718 3.106 3.497 4.025 4.437 11 3.930 4.318 0.695 0.873 1.083 2.303 3.055 3.428 0.870 1.079 2.160 3.012 3.852 4.221 3 787 14 1.076 2.145 2.624 4.140 0.692 0.868 3.326 15 0.866 1.074 1.341 1.753 2.131 2.249 2.602 2.947 3.286 3:733 4.073 15 0.691 0.865 1.071 2.120 2.921 3.252 3.686 4.015 16 2.110 2.898 3.222 3.646 3.965 2.101 2.878 3.197 3.610 3.883 0.688 1.328 2.093 2.205 3.174 3.579 0.687 0.860 1.064 1.725 2.086 2.197 2.528 2.845 3.153 3.552 3.850 0.686 0.859 2.080 2.189 2.831 3.819 2.183 2 508 2.069 2.807 3.768 2.064 2.797 3.745 0.684 1.708 2.060 2.787 3.725 0.684 1.058 1.706 2.056 2.162 2479 2.779 3.067 3.435 3.707 1.703 2052 2:158 3.057 3.421 0.683 1.701 2.048 2.763 3.047 3.674 0.683 2.045 2.150 2:756 3.038 3.659 0.683 1.697 2.042 2.457 2.750 3.030 3.385 3.646 2.040 2.144 2.453 2.744 3.022 3.375 3.633 2.037 2.141 2.738 .015 3.365 3.622 0.682 0.853 2.035 3.008 3.611 0.852 2.032 3.601 0.682 3 591 0.682 0.852 1.052 1.306 2.030 2.133 2.724 .340 0.681 0.852 1.052 1.306 2.028 2.131 2.434 2.719 2.990 3.333 3.582 2.026 2.129 2.715 985 3.574 3.566 1:050 2.023 2.125 2.976 3.313 3.558 0.681 0.851 1.050 1.303 2.021 2.123 2.423 2.704 2971 3.307 3.551 0.679 0.849 1.299 1.676 2.009 2.109 2.403 2.678 2.937 3.261 3.496 50 0.679 0.848 1.671 2.000 2.099 2.390 0.678 1.044 2.093 2.660 2.915 3.232 3.460 3.211 0.678 1.043 1.292 2887 3.416 0.846 1.042 1.291 1.662 2.084 2. 368 2.639 2.632 2.878 3:183 3.402 90 0.677 0.845 1042 1.660 2.081 2.626 2.871 3.174 3.390 100 0.675 0.842 1.037 1.282 1.646 1.962 2.056 2.330 2.581 2.813 3.098 3.300 1000 0.842 1.036 2:576 2 807 3:090 3.291 z 0.674 0.0025 0.001 0.0005 df df 0.25 0.20 0.15 0.10 0.05 0.025 0.02 0.01 0.005 Print Done Clear All Final Check Textbook StatCrunch Get More Help -In a study. researchers wanted to measure the effect of alcohol on the hippocampal region. the portion of the brain responsible for long-term memory storage. in adolescents, The researchers randomly selected 17 adolescents with alcohol use disorders to determine whether the hippocampal volumes in the alcoholic adolescents were less than the normal volume at 902 cms. An analysis of the sample data revealed that the hippocampal volume is approximately normal with no outliers and )_ 0.5 (Type integers or decimals. Do not round.) Which distribution should be used for this hypothesis test? A. The normal distribution because the parameter is a proportion, p, and the model conditions are satisfied. O B. The normal distribution because the parameter is the mean, o is known, and the model conditions are satisfied. O C. The Student's t-distribution because the parameter is the mean, o is not known, and the model conditions are satisfied. O D. The chi-square distribution because the parameter is o or of, and the model conditions are satisfied. Calculate the test statistic. Test statistic = 2.83 (Round to two decimal places as needed.) Calculate the P-value. P-value = (Round to three decimal places as needed.) Help Me Solve This View an Example Get More Help - Clear All Check Answer6 A simple random sample of size n = 15 is drawn from a population that is normally distributed. The sample mean is found to be x = 24.4 and the sample standard deviation is found to be s = 6.3. Determine if the population mean is different from 26 at the a = 0.01 level of significance. Complete parts (a) through (d) below. (a) Determine the null and alternative hypotheses. He: = 26 Hy: # 26 (b) Calculate the P-value. P-value = (Round to three decimal places as needed.) Help Me Solve This View an Example Get More Help - Clear All Check Answer7 through (c) below. Suppose you wish to determine if the mean IQ of students on a certain campus is different from the mean IQ in the general population, 100. To conduct this study, you obtain a simple random sample of 50 students on this campus, administer an IQ test, and record the results. The mean IQ of the sample of 50 students is found to be 106.5 with a standard deviation of 12.6. Complete parts (a) Click the icon to view the t-distribution table. (a) Construct a hypothesis test Ho: H = Ho versus H1 : H # Ho for Ho = 102, 103, 104, 105, 106, 107, 108, 109, 110, and 111 at a = 0.05 level of significance. Determine the test statistics for Ho = 102, 103, 104, 105, and 106. Table of Critical t-Values -X Ho = 102 to = 2.53 Ho = 103 to = 1.96 10 = 104 0 = 1.40 Ho = 105 0 = 0.84 Ho = 106 to = 0.28 right tail (Round to two decimal places as needed.) 1-Distribution Determine the test statistics for Ho = 107, 108, 109, 110, and 111. Degrees of Area in Right Tai Freedom 0.25 0.20 0.15 0.10 0.05 0.025 0.02 0.01 0.005 0.0025 0.001 6.0605 Ho = 107 to = 1.000 1.376 3.078 6.314 15.894 63.657 1061 636.610 Ho = 108 to = 2.353 2:776 12.924 0.920 o = 109 to = 0 2.571 5.893 6:869 0.718 0.906 1.440 4.317 5.208 5.959 Ho = 110 to = [ 4.785 4.501 5.041 Ho = 111 to = 4.144 4.781 (Round to two decimal places as needed.) 4.437 3:733 4.140 4.073 3.340 3.307 0.677 0.675 1.037 0674 3.300 2.326 3201 Degrees of 0.25 0.20 0.15 0.10 0.05 0.025 0.02 0.01 0.005 0.0025 0.001 0.0005 Freedom f-Distribution Area in Right Tai Help Me Solve This View an Example Get More Help - Print Done
Step by Step Solution
There are 3 Steps involved in it

Get step-by-step solutions from verified subject matter experts