

Question: Need help with statistics. First part: Based on my answers, I need help with d question ?Second part: Need help with the whole question This
Need help with statistics.
First part: Based on my answers, I need help with d question
?Second part: Need help with the whole question
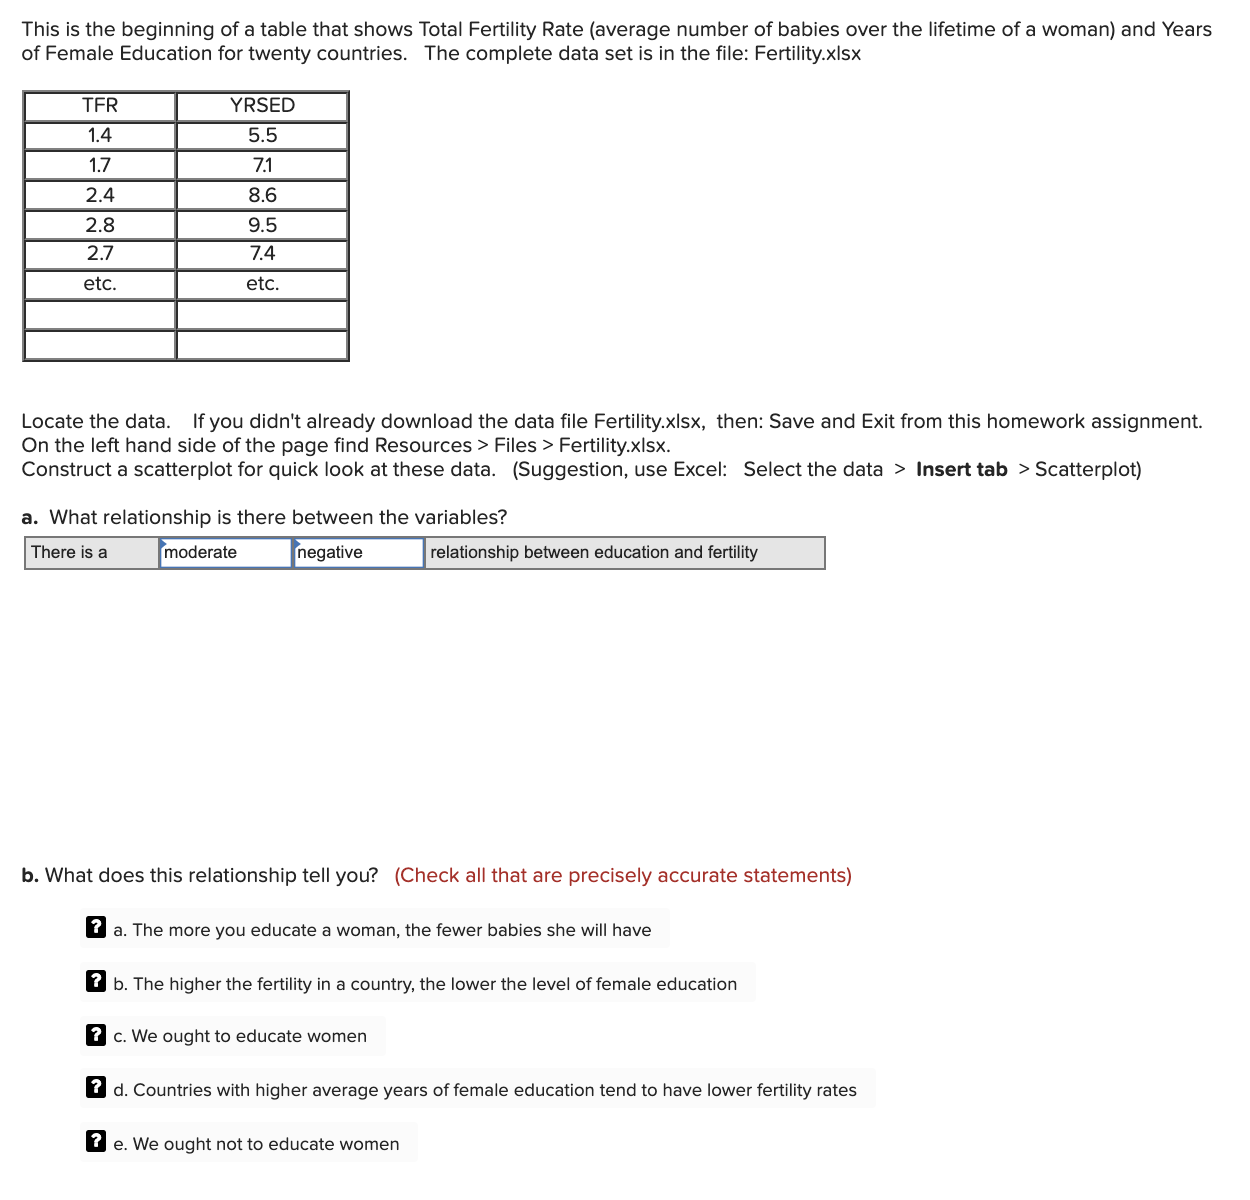
This is the beginning of a table that shows Total Fertility Rate (average number of babies over the lifetime of a woman) and Years of Female Education for twenty countries. The complete data set is in the le: Fertilityxlsx Locate the data. If you didn't already download the data file Fertilityxlsx, then: Save and Exit from this homework assignment. 0n the left hand side of the page nd Resources > Files > Fertility.xlsx. Construct a scatterplot for quick look at these data. (Suggestion, use Excel: Select the data > Insert tab > Scatterplot) a. What relationship is there between the variables? eeeeneee eemeen eeueeeen eerie b. What does this relationship tell you? {Check all that are precisely accurate statements) a. The more you educate a woman, the fewer babies she will have b. The higher the fertility in a country. the lower the level of female education c. We ought to educate women d. Countries with higher average years of female education tend to have lower fertility rates e. We ought not to educate women
Step by Step Solution
There are 3 Steps involved in it

Get step-by-step solutions from verified subject matter experts