

Question: NEED HELP WITH STEP 3 & 4. (The table from Step 2 is at the bottom) Revenue Units Sold 1200 1400 1600 1800 2000 Price
NEED HELP WITH STEP 3 & 4. (The table from Step 2 is at the bottom)
| Revenue | ||||||
| Units Sold | 1200 | 1400 | 1600 | 1800 | 2000 | |
| Price per Unit | $ 198.00 | $ 198.00 | $ 198.00 | $ 198.00 | $ 198.00 | |
| Total Revenue | $ 237,600.00 | $ 277,200.00 | $ 316,800.00 | $ 356,400.00 | $396,000.00 | |
| Variable Expenses | ||||||
| Units Produced | 1200 | 1400 | 1600 | 1800 | 2000 | |
| Material cost per Unit | $ 50.00 | $ 50.00 | $ 50.00 | $ 50.00 | $ 50.00 | |
| Total Material Cost | $ 60,000.00 | $ 70,000.00 | $ 80,000.00 | $ 90,000.00 | $100,000.00 | |
| Manufacturing Cost per Unit | $ 30.00 | $ 30.00 | $ 30.00 | $ 30.00 | $ 30.00 | |
| Manufacturing Expenses | $ 36,000.00 | $ 42,000.00 | $ 48,000.00 | $ 54,000.00 | $ 60,000.00 | |
| Total Variable Expense | $ 96,000.00 | $ 112,000.00 | $ 128,000.00 | $ 144,000.00 | $160,000.00 | |
| Fixed Expenses | ||||||
| Leasing | $ 10,000.00 | $ 10,000.00 | $ 10,000.00 | $ 10,000.00 | $ 10,000.00 | |
| Salary and benefits | $ 90,000.00 | $ 90,000.00 | $ 90,000.00 | $ 90,000.00 | $ 90,000.00 | |
| Advertisement | $ 10,000.00 | $ 10,000.00 | $ 10,000.00 | $ 10,000.00 | $ 10,000.00 | |
| Administrative | $ 10,000.00 | $ 10,000.00 | $ 10,000.00 | $ 10,000.00 | $ 10,000.00 | |
| Total Fixed Expense | $ 120,000.00 | $ 120,000.00 | $ 120,000.00 | $ 120,000.00 | $120,000.00 | |
| Summary | ||||||
| Total Expenses | $ 216,000.00 | $ 232,000.00 | $ 248,000.00 | $ 264,000.00 | $280,000.00 | |
| Operating Income | $ 21,600.00 | $ 45,200.00 | $ 68,800.00 | $ 92,400.00 | $116,000.00 |
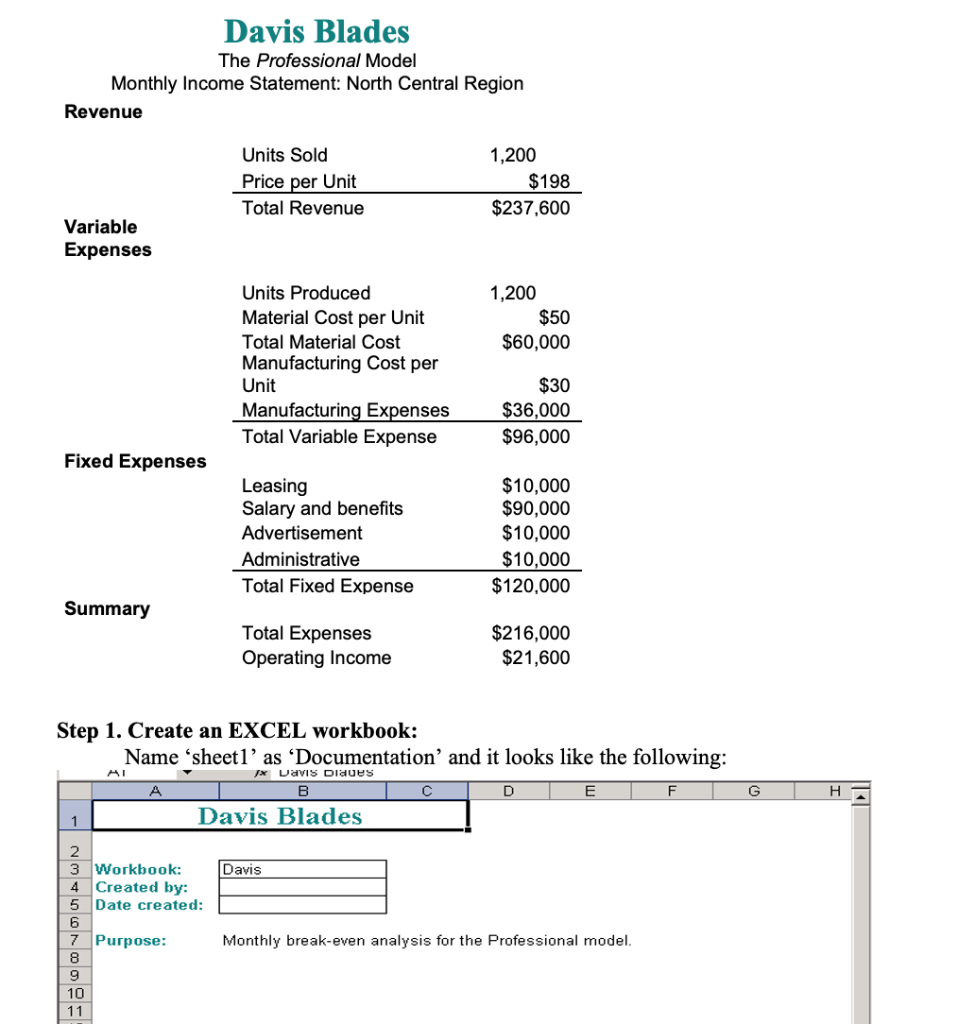
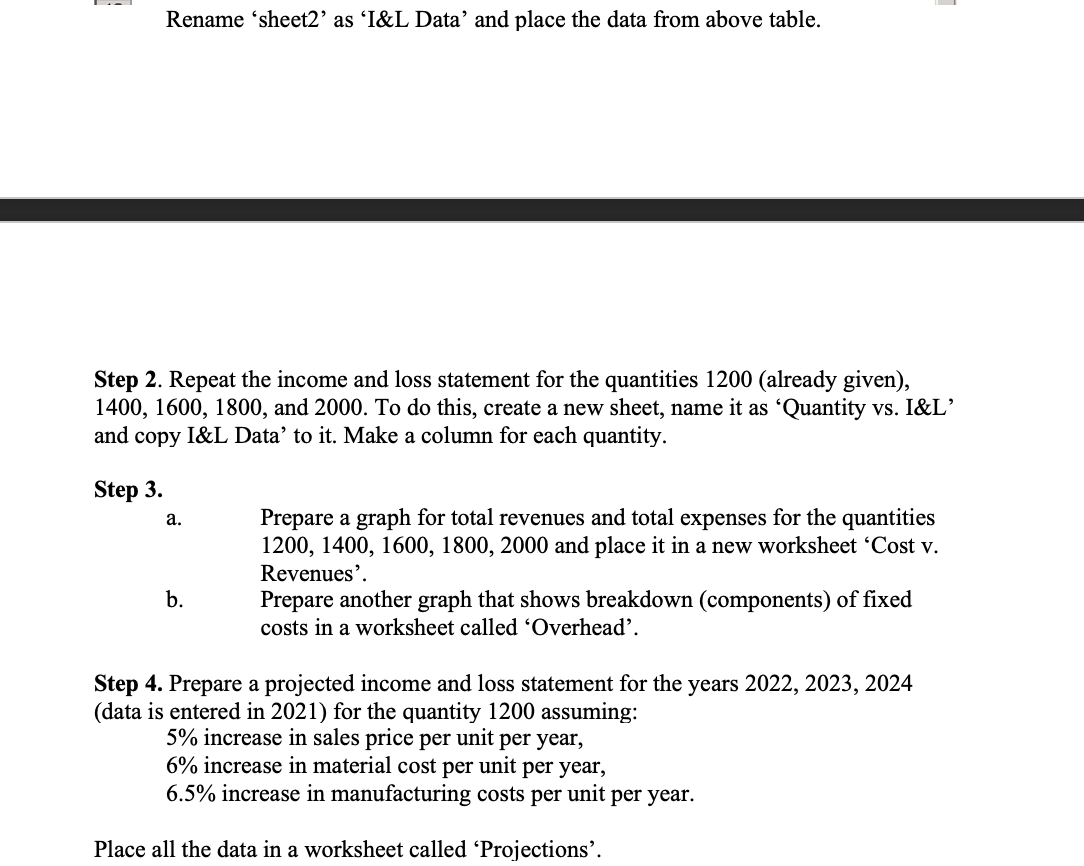
Davis Blades The Professional Model Monthly Income Statement: North Central Region Revenue Units Sold Price per Unit Total Revenue 1,200 $198 $237,600 Variable Expenses 1,200 $50 $60,000 Units Produced Material Cost per Unit Total Material Cost Manufacturing Cost per Unit Manufacturing Expenses Total Variable Expense $30 $36,000 $96,000 Fixed Expenses Leasing Salary and benefits Advertisement Administrative Total Fixed Expense $10,000 $90,000 $10,000 $10,000 $120,000 Summary Total Expenses Operating Income $216,000 $21,600 Step 1. Create an EXCEL workbook: Name 'sheetlas Documentation' and it looks like the following: 1x Davis Diales B A D E F G H 1 Davis Blades Davis 2 3 Workbook: 4 Created by: 5 Date created: 6 7 Purpose: 8 9 10 11 Monthly break-even analysis for the Professional model. Rename sheet2' as 'I&L Data and place the data from above table. Step 2. Repeat the income and loss statement for the quantities 1200 (already given), 1400, 1600, 1800, and 2000. To do this, create a new sheet, name it as 'Quantity vs. I&L and copy I&L Data to it. Make a column for each quantity. Step 3. a. Prepare a graph for total revenues and total expenses for the quantities 1200, 1400, 1600, 1800, 2000 and place it in a new worksheet 'Cost v. Revenues'. Prepare another graph that shows breakdown (components) of fixed costs in a worksheet called 'Overhead'. b. Step 4. Prepare a projected income and loss statement for the years 2022, 2023, 2024 (data is entered in 2021) for the quantity 1200 assuming: 5% increase in sales price per unit per year, 6% increase in material cost per unit per year, 6.5% increase in manufacturing costs per unit per year. Place all the data in a worksheet called Projections
Step by Step Solution
There are 3 Steps involved in it

Get step-by-step solutions from verified subject matter experts