

Question: need help with the bottom row The following table shows the actual demand observed over the last 11 yoars: Using exponential smoothing with =0.50 and
 need help with the bottom row
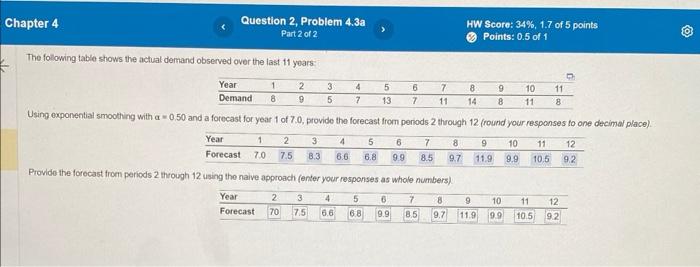
The following table shows the actual demand observed over the last 11 yoars: Using exponential smoothing with =0.50 and a forecast for year 1 of 7.0, prov
Step by Step Solution
There are 3 Steps involved in it
1 Expert Approved Answer
Step: 1 Unlock

Question Has Been Solved by an Expert!
Get step-by-step solutions from verified subject matter experts
Step: 2 Unlock
Step: 3 Unlock