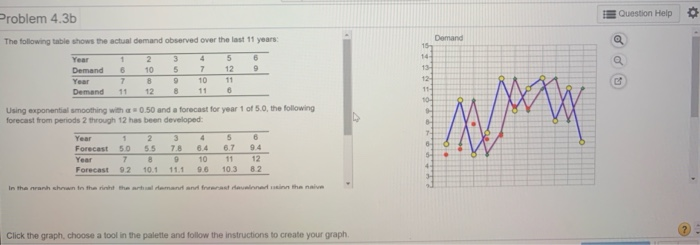
Question: Question Help 0 Problem 4.3b The following table shows the actual demand observed over the last 11 years Demand 15 7 13 12 11 10

Question Help 0 Problem 4.3b The following table
Question Help 0 Problem 4.3b The following table shows the actual demand observed over the last 11 years Demand 15 7 13 12 11 10 Year 1 2. 3 4 5 6 Demand 6 10 5 7 12 9 Year 8 9 10 11 Demand 11 12 8 11 8 Using exponential smoothing with a 0.50 and a forecast for year 1 of 5.0, the following forecast from periods 2 through 12 has been developed Year 1 2 4 5 6 Forecast 50 5.5 7.8 6.7 7 8 9 10 12 Forecast 92 10.1 9.6 10.3 82 / TA 8 Year 5 4 In the near shown in the in the woman and fast med the name Click the graph, choose a tool in the palette and follow the instructions to create your graph, Question Help Problem 4.36 Using exponential smoothing with 0.50 and a forecast for year 1 of 5.0, the following forecast from periods 2 through 12 has been developed Demand 15 1.8 Year 13 12 11 10 Year 1 2 3 5 Forecast 50 5.5 6.7 7 8 10 12 Forecast 92 10.1 11.1 9.6 10.3 8.2 In the graph shown to the right, the actual demand and forecast developed using the naive approach are plotted. The forecasts derived using exponential smoothing are plotted for the first seven years Using the point drawing tool five times, plot the forecasts derived using exponential smoothing given in the table above for years 8 - 12 = 0.50 and a starting forecast = 5.0). Note: Carefully follow the instructions above and only draw the required objects 5 4 Click the graph, choose a tool in the palette and follow the instructions to create your graph and a forecast for year 1 of 5.0, the following en developed 3 7.8 9 11.1 U 4 6.4 10 9.6 5 6.7 11 10.3 5- 4- 3- 2- 1- 0+ 0 6 9.4 12 8.2 . .1 8 9 10 11 12 Year al demand and forecast developed using the naive wed using exponential smoothing are plotted for the plot the forecasts derived using exponential smoothing 2 (a = 0.50 and a starting forecast = 5.0). bove and only draw the required objects. Blue Line - Actual Demand Purple Line = Naive Approach Forecast Red Dots = Forecasts for Exponential Smoothing for Years 1 - 7 Use the arrow keys to precisely move a selected point. - palette and follow the instructions to create your graph

Step by Step Solution

There are 3 Steps involved in it

1 Expert Approved Answer
Step: 1 Unlock blur-text-image
Question Has Been Solved by an Expert!

Get step-by-step solutions from verified subject matter experts

Step: 2 Unlock
Step: 3 Unlock

Students Have Also Explored These Related General Management Questions!