

Question: *NEED HELP WITH THE GREEN SECTION* *As well with the questions* C: ing Pedeme do U et de coco 30152000 W We 2016 th MEN'S
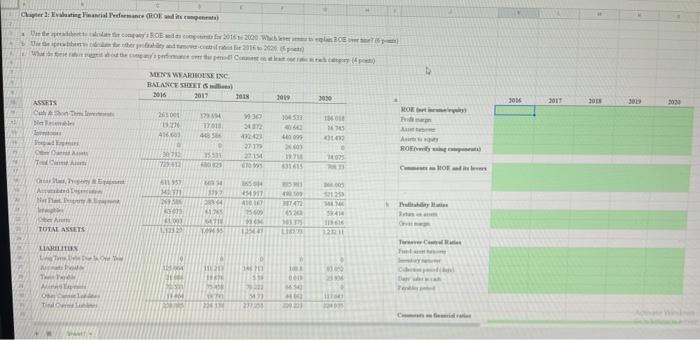
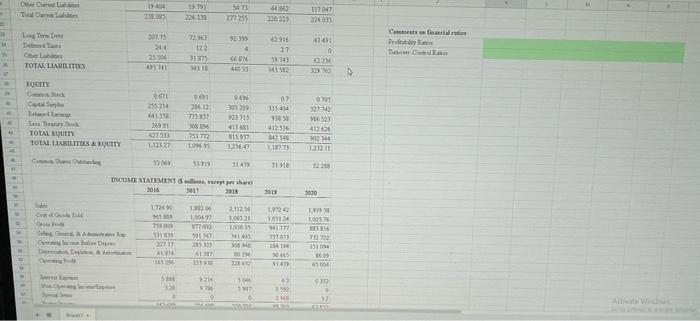
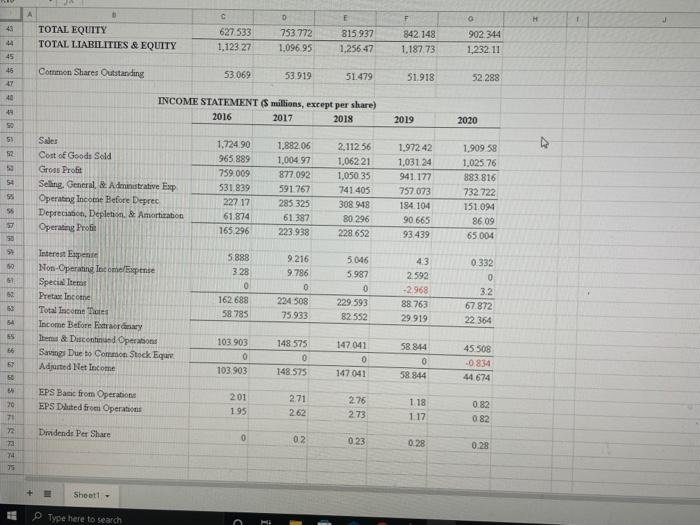
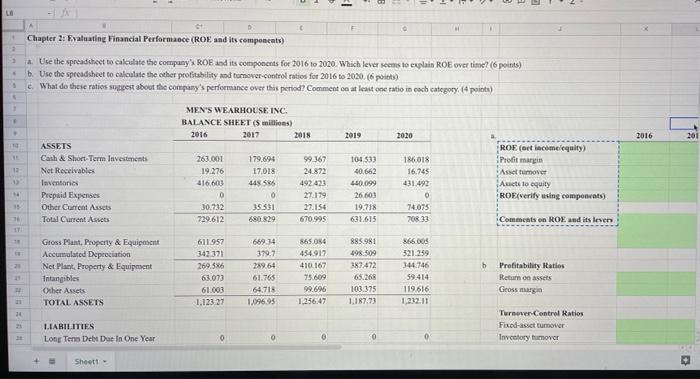
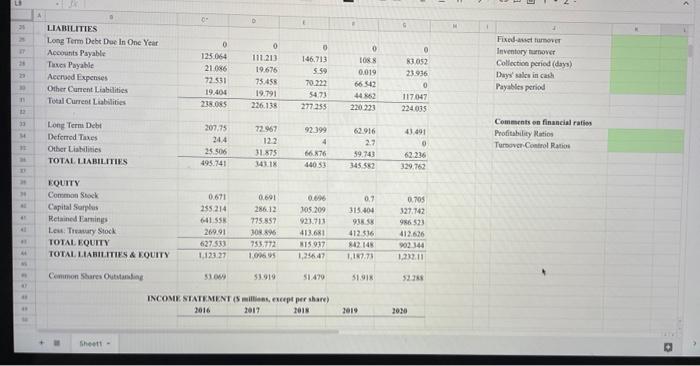
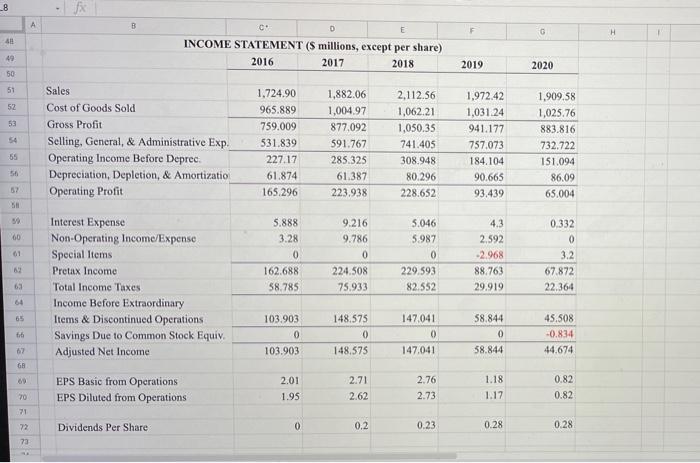
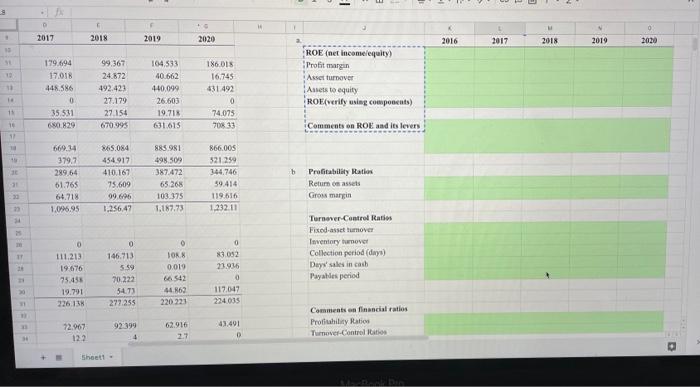
C: ing Pedeme do U et de coco 30152000 W We 2016 th MEN'S WARHOUSE INC. BALANCE SHEET 2016 2017 TOES 2019 30:30 ASSES 10 2017 3019 2030 MO Chem Die 100 NI 30 1701 43 1670 4160 10 0 LON A RO WO SELDE 15511 2717 2014 27 723411 TA 121 1615 CHO 1997 CH 31 0949 12 WEN 250 14 4120 ry SAT WS MM TOTAL ANSETS 16 11 LIT TC LUARELLES . LIE 1 LE T HEN con har CH 97 O TO HERE OL TO 19406 5473 15.790 226138 098 COBEZ SE UZ 200221 112047 220035 Lumen SETE 307.71 244 25304 19 Profit TC 6291 27 15,74) 122 0 UN W 0 1223 CUBE BECH TOTAL LIARITIES ISA COS CALCE ! EQUITY ch 1090 2020 0923 235214 41.350 2560 77867 CHER theid TOTAL EQUITY TOTALLIASILIRSA KOUTY 1569 FESTES SOC 922713 4116 115 13500 07 11544 93858 412534 14243 18273 06523 41202 10244 12011 11231 LA 01 DO 3900 5319 51.0 3220 INCOME STATEMENT 2014 2011 2018 2015 2020 ME 1.734 1 300 B6061 106 11 TW 2112 100 19720 10314 1171 AL DES 16 141450 MOME MLER E CLOSE 25 7222 1510 15411 SW EU HEGE CLE E 6100 3566 MEE LS HE 3 352 210 >> A 0 E H 1 43 TOTAL EQUITY TOTAL LIABILITIES & EQUITY 627 533 1,123 27 753.772 1.096.95 815 937 1.256-47 842.148 1.187.73 902.344 1.232.11 45 45 Common Shares Outstanding 53069 53.919 51.479 51.918 52 288 47 40 INCOME STATEMENT (S millions, except per share) 2016 2017 2018 49 2019 2020 50 51 54 Sales Cost of Goods Sold Gross Profit Seling. General Administrative Exp Operating Income Before Deprec Depreciation, Depletion & Amortization Operating Profit 1,724.90 965.889 759.009 531 839 227 17 61.874 165.296 1.882.06 1,00497 877 092 591 767 285 325 61 387 223 938 2,112 56 1,06221 1,050 35 741 405 308 948 80 296 228 652 1.97242 1,031.24 941.177 757073 184 104 90 665 93.439 55 1,909.58 1.025 76 883.816 732 722 151 094 86 09 65.004 55 50 > 50 5.888 3.28 51 9216 9.786 0 224 508 75.933 Interest Expense Non-Operating Income/spense Specialiteter Preta Income Total Income Tres Income Before Extraordinary Tem & Duscontinued Operations Savings Due to Common Stock Eque Adjusted Net Income 5046 5 987 0 229 593 82552 43 2592 -2.968 88.763 29919 62 0.332 0 3.2 67.872 22 364 50 162.688 58785 54 55 56 58 844 103 903 0 103.903 148.575 0 148.575 147041 0 147041 57 0 45.508 -0.834 44.674 58 844 EPS Basic from Operabot EPS Dlated from Operations 70 201 195 2.71 2.62 2.76 273 1 18 117 SRRRRR 0.82 082 72 Didends Per Share 0 02 023 0.28 0.28 Sheett- Type here to search Chapter 2: Evaluating Financial Performance (ROE and its components) 2 3 * Use the spreadsheet to calculate the company ROEasdits components for 2016 to 2020. Which lever seems to explain ROE over time? (6 points) b. Use the spreadsheet to calculate the other profitability and turnover-control ratios for 2016 to 2020. (6 points) c. What do these ration suppest about the company's performance over this period? Comment on at least one ratio in each category. (4 points) MEN'S WEARHOUSE INC. BALANCE SHEET (5 millions) 2016 2017 2015 2019 2020 2016 201 186018 16.245 ASSETS Cash & Short Term Investments Net Receivables Inventaries Prepaid Expenses Other Current Assets Total Current Assets 263.001 19.276 416,603 0 30.732 729.612 179.694 17.018 4586 0 35.531 680829 99.367 24.872 492 423 27.179 27.154 670 995 104533 40,662 4.0.099 26603 19.718 631,615 ROE (net income equity) Profit margin Asset tumover Aucts to quity ROE/verify using components) 15 0 74.075 208 33 Comments on ROE and its lever 17 1 611957 342371 269.586 63.073 b Gross Plant, Property & Equipment Accumulated Depreciation Net Plant, Property & Equipment Intangibles Other Assets TOTAL ASSETS 66934 379.7 289 64 61.765 64715 1.096.95 #M 865056 454917 410.167 75.609 99.696 1.256.47 885981 498.509 387.472 65.268 103 175 1.167.73 366.005 521.259 344.746 59.414 119.616 1.232.11 Profitability Natios Return on assets Gross margin 61.003 1.123 27 LIABILITIES Long Term De Due In One Year Turnover Control Ratios Fixed asset turnover Inventory hmover 0 o 0 Sheet - a 09 D 30 LIABILITIES Long Term Debt Do In One Year Accounts Payable Theses Payable Acered Expenses Other Content Liabilities Total Current Liabilities 0 125 054 21.046 72531 19.404 218.085 0 111.213 19.676 73.458 19.791 226.138 0 146.713 5.59 70.222 5473 277233 0 TOR 0,019 66542 44862 220 223 0 R3052 23.936 0 117047 224035 Fixed-cover Inventory turnover Collection period (daya) Days' sales in cash Payables period 1 13 33 92399 Long Term Debt Deferred Taxes Other Lisabilities TOTAL LIABILITIES 207.75 24.4 25 506 495.741 72.967 122 31.875 3431% 62.916 2.7 59.743 345 562 4 66.876 440 53 Comments on financial raties Profitability Ratio Turnover Control Ratio 43.491 0 62236 329.762 0.703 EQUITY Common Stock Capital Surplus Retained Earnings Lew Trwy Stock TOTAL EQUITY TOTAL LIABILITIES & EQUITY 0.671 255214 6-15 269.91 627533 1.123.27 0.691 286.12 775 857 308.896 753.772 1.06 O. 105 209 921.713 413.681 15 037 1,25647 0.7 315.404 90 SX 4122516 842 145 1.17.73 327.742 986 523 412.626 2140 1.232.11 Common Shares Outstanding 31.069 53919 51470 51913 52.355 INCOME STATEMENT (5 millions, except per share 2016 2018 2019 2020 She- 8 fx A B D E F G H 48 INCOME STATEMENT (S millions, except per share) 2016 2017 2018 49 2019 2020 50 51 52 53 Sales Cost of Goods Sold Gross Profit Selling, General, & Administrative Exp. Operating Income Before Deprec Depreciation, Depletion, & Amortizatio Operating Profit 1.724.90 965.889 759.009 531.839 227.17 61.874 165.296 1,882.06 1,00497 877,092 591.767 285.325 61.387 223.938 2,112.56 1,062.21 1,050.35 741.405 308.948 80.296 228.652 1,972.42 1,031.24 941.177 757.073 184.104 90.665 93.439 1,909.58 1,025.76 883.816 732.722 151.094 86.09 65.004 55 56 57 60 01 Interest Expense Non-Operating Income/Expense Special Items Pretax Income Total Income Taxes Income Before Extraordinary Items & Discontinued Operations Savings Due to Common Stock Equiv. Adjusted Net Income 5.888 3.28 0 162.688 58.785 9.216 9.786 0 224.508 75.933 5.046 5.987 0 229.593 82.552 4.3 2.592 -2.968 88.763 29.919 0.332 0 3.2 67.872 22.364 63 64 65 fi 103.903 0 103.903 148.575 0 148.575 147.041 0 147.041 58.844 0 58.844 45.508 -0.834 44.674 67 GR EPS Basic from Operations EPS Diluted from Operations 2.01 1.95 2.71 2.62 2.76 2.73 1.18 1.17 0.82 0.82 71 72 Dividends Per Share 0 0.2 0.23 0.28 0.28 73 D 2017 2018 2019 2020 2016 2017 2018 2019 2020 12 19.694 17.018 448.586 0 35.531 680.829 === 99.367 24.872 492.423 27.179 27.154 670.995 ROE (net income equity) Profit margin Asset urnover Assetto equity ROE verily using components) 104.333 40.662 440,099 26.603 19.718 631.615 186 DIS 16,745 431 492 0 74.075 70833 11 Comments on ROE and its levers h 669.34 379.7 28964 61.765 64.718 1.095.95 865.084 454917 410.167 75,609 99 696 1.256.47 885981 498.509 387.472 65.268 103.375 1.167.73 866.005 321.259 144.746 59.414 119.616 1.232.11 30 Profitability Ratio Return on assets Gross margin 30 TF 0 111213 19676 75.45 19.791 226.1 18 0 146.713 5.59 70.222 547) 279.255 Turnover Control Ratio Fixed-asset turnover Inventory tumover Collection period (days) Days' sales in cash Payalles period 0 JOR 0.019 66.542 44.862 220.223 0 83.092 23.936 0 117.047 224035 72.967 122 92399 1 62.916 2.7 Comments on financial ratios Profily Ratio Turnover-Controllation 43.491 D 3 Shoot
Step by Step Solution
There are 3 Steps involved in it

Get step-by-step solutions from verified subject matter experts