

Question: Need help with the question below, also attached the data collected. {QUESTION:- Convert the concentration of each standard solution from molar (M) to micromolar (M).
Need help with the question below, also attached the data collected.
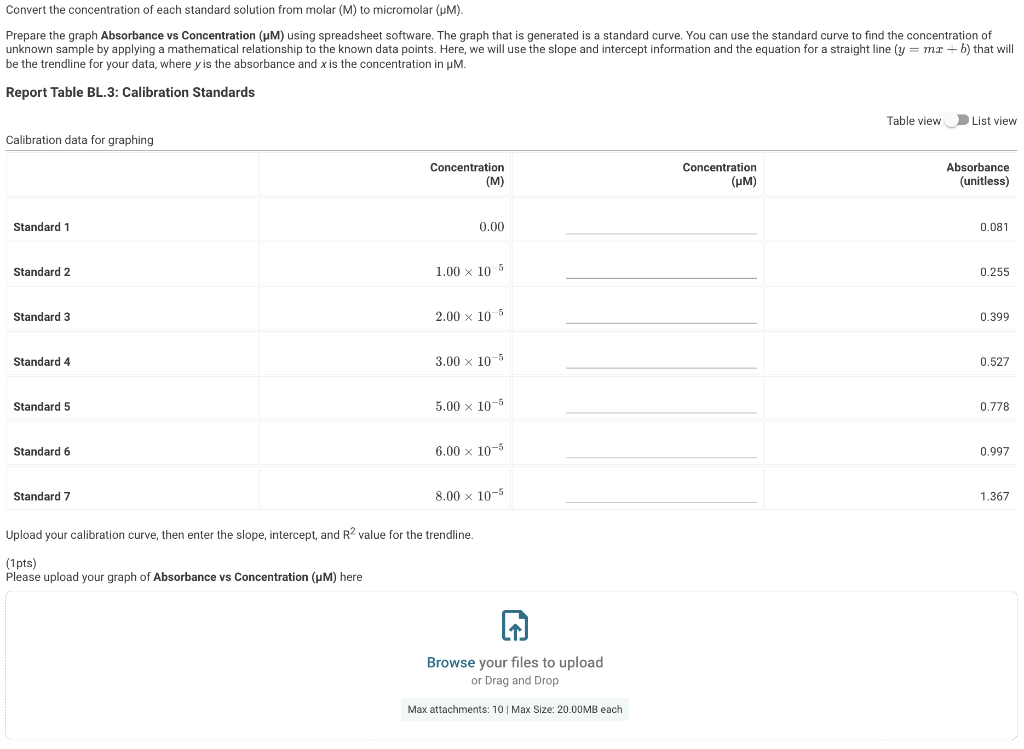
{QUESTION:- Convert the concentration of each standard solution from molar (M) to micromolar (M).
Prepare the graph Absorbance vs Concentration (M) using spreadsheet software. The graph that is generated is a standard curve. You can use the standard curve to find the concentration of unknown sample by applying a mathematical relationship to the known data points. Here, we will use the slope and intercept information and the equation for a straight line (y=mx+by=mx+b) that will be the trendline for your data, where y is the absorbance and x is the concentration in M.}
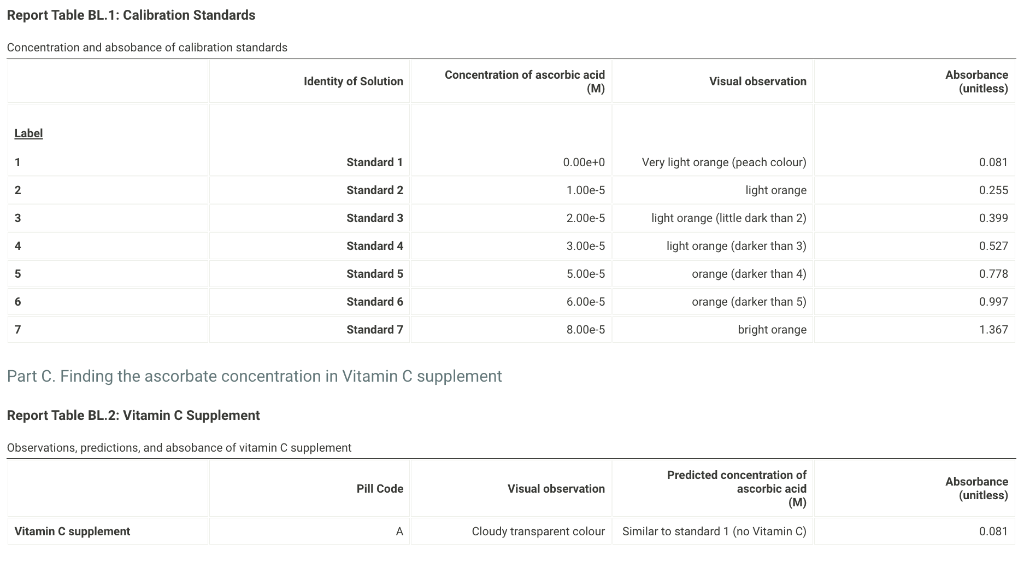
Report Table BL.1: Calibration Standards Concentration and absobance of calibration standards Part C. Finding the ascorbate concentration in Vitamin C supplement Convert the concentration of each standard solution from molar (M) to micromolar (M). Prepare the graph Absorbance vs Concentration (M) using spreadsheet software. The graph that is generated is a standard curve. You can use the standard curve to find the concentration of unknown sample by applying a mathematical relationship to the known data points. Here, we will use the slope and intercept information and the equation for a straight line (y=mx+b) that will be the trendline for your data, where y is the absorbance and x is the concentration in M. Report Table BL.3: Calibration Standards Table view D List view Calibration data for graphing Upload your calibration curve, then enter the slope, intercept, and R2 value for the trendline. (1pts) Please upload your graph of Absorbance vs Concentration ( M) here
Step by Step Solution
There are 3 Steps involved in it

Get step-by-step solutions from verified subject matter experts