

Question: Note that all mixtures for Part A and Part B are made acidic by the presence of nitric acid. While the hydronium ion does not
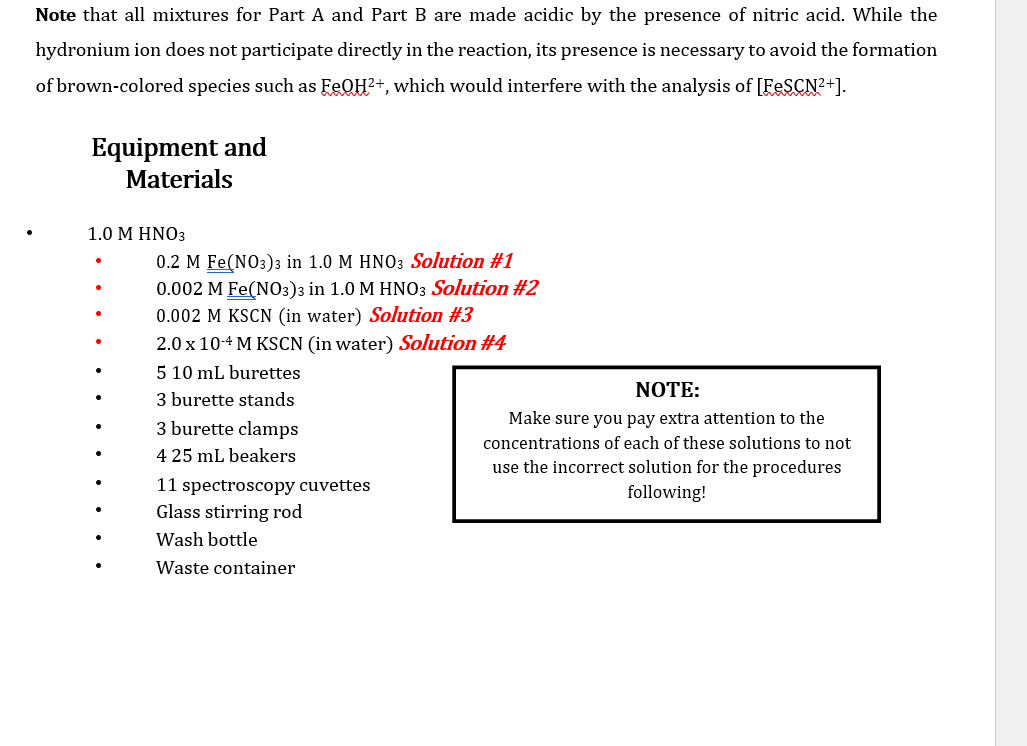
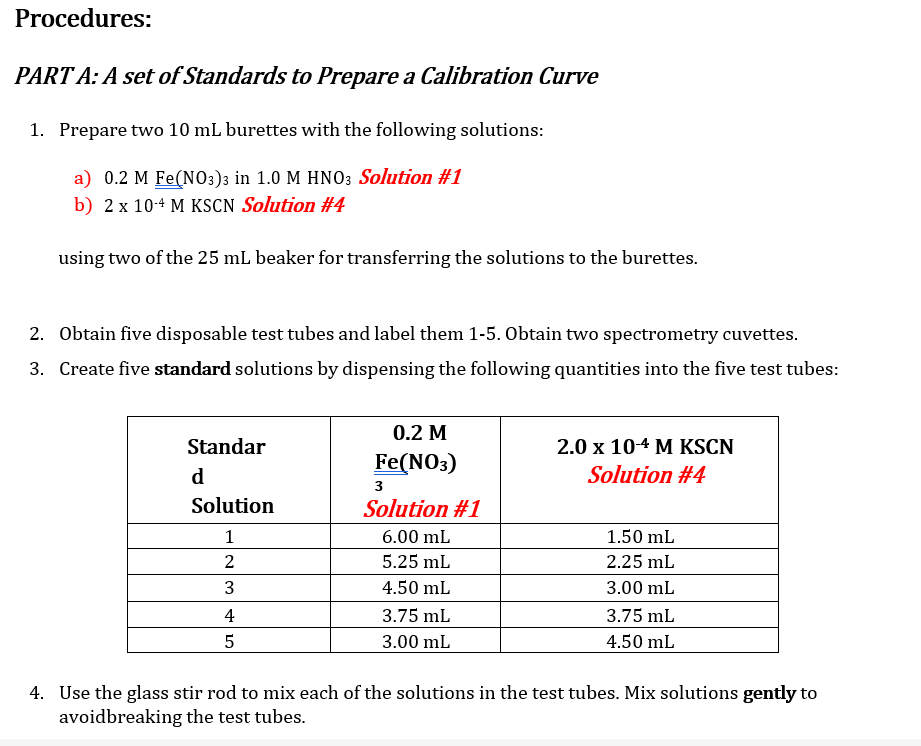
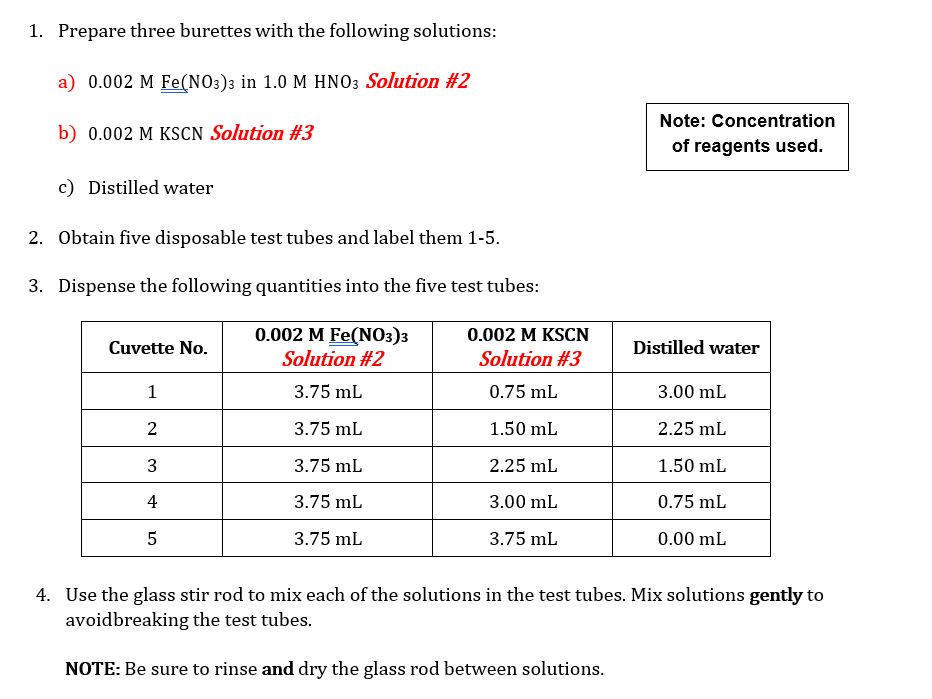
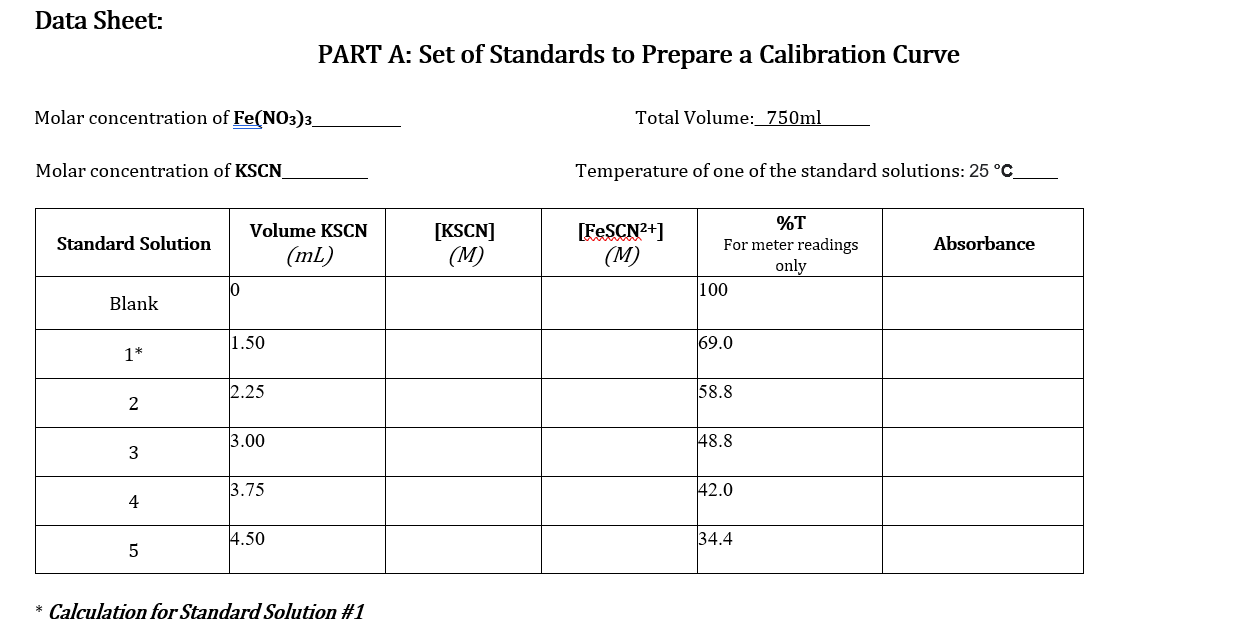
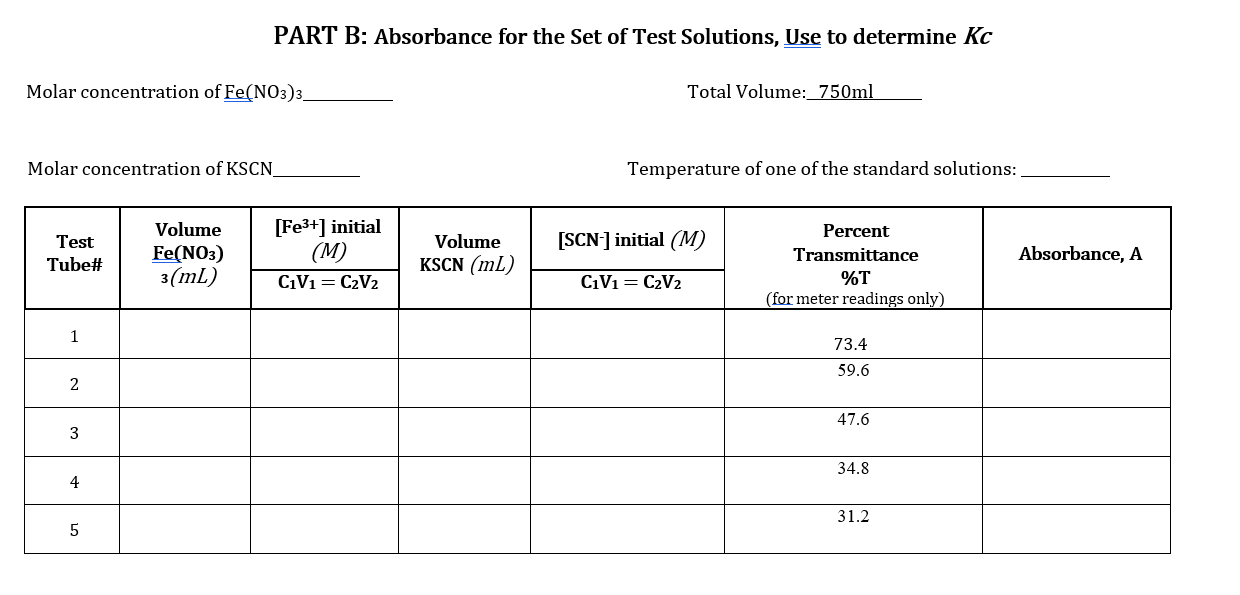
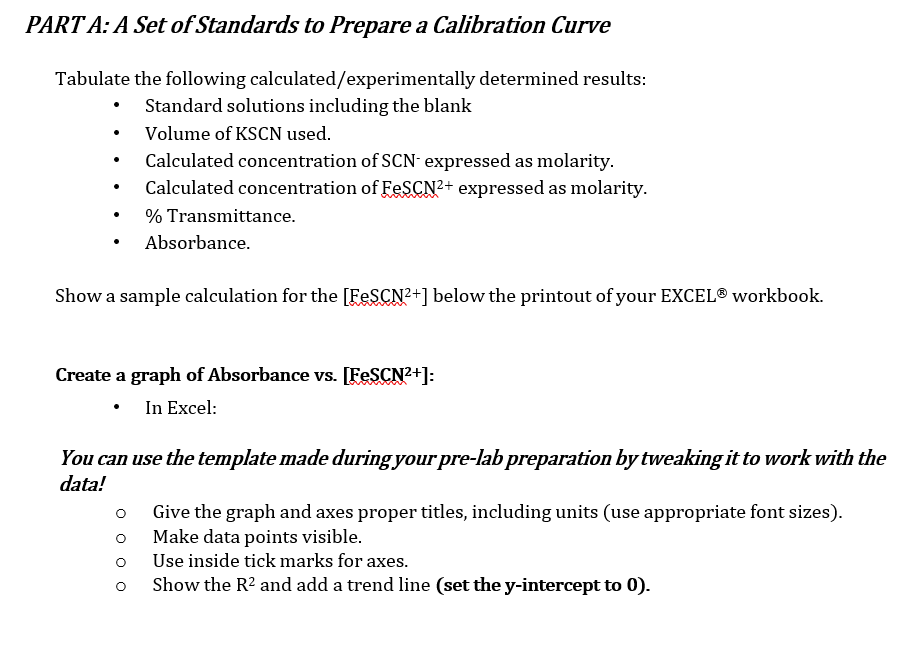
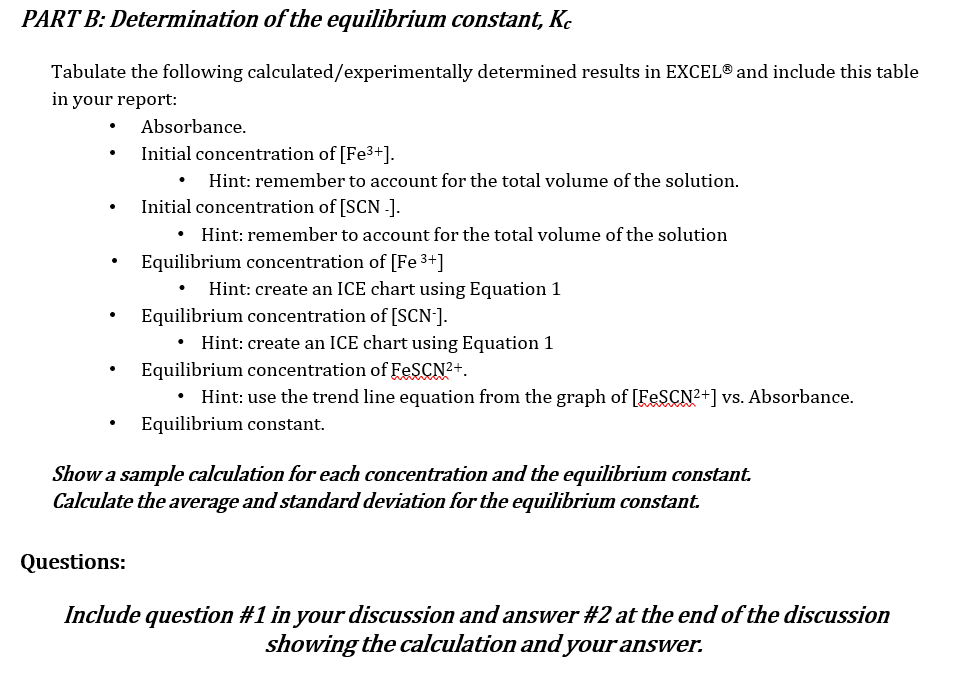
Note that all mixtures for Part A and Part B are made acidic by the presence of nitric acid. While the hydronium ion does not participate directly in the reaction, its presence is necessary to avoid the formation of brown-colored species such as FeQH2+, which would interfere with the analysis of [FeSCN2+). Equipment and Materials . 1.0 M HNO3 0.2 M Fe(NO3)3 in 1.0 M HNO3 Solution #1 0.002 M Fe(NO3)3 in 1.0 M HNO3 Solution #2 0.002 M KSCN (in water) Solution #3 2.0 x 10⁻⁴ M KSCN (in water) Solution #4 5 10 mL burettes NOTE: 3 burette stands 3 burette clamps Make sure you pay extra attention to the concentrations of each of these solutions to not 425 ml beakers use the incorrect solution for the procedures 11 spectroscopy cuvettes following! Glass stirring rod Wash bottle Waste container Procedures: PART A: A set of Standards to Prepare a Calibration Curve 1. Prepare two 10 mL burettes with the following solutions: a) 0.2 M Fe(NO3)3 in 1.0 M HNO3 Solution #1 b) 2 x 10⁻⁴ M KSCN Solution #4 using two of the 25 mL beaker for transferring the solutions to the burettes. 2. Obtain five disposable test tubes and label them 1-5. Obtain two spectrometry cuvettes. 3. Create five standard solutions by dispensing the following quantities into the five test tubes: 2.0 x 10⁻⁴ M KSCN Solution #4 Standar d Solution 1 2 0.2 M Fe(NO3) 3 Solution #1 6.00 mL 5.25 ml 4.50 mL 3.75 ml 3.00 mL WN 1.50 mL 2.25 mL 3.00 mL 3.75 ml 4.50 mL 4 | 5 4. Use the glass stir rod to mix each of the solutions in the test tubes. Mix solutions gently to avoidbreaking the test tubes. 1. Prepare three burettes with the following solutions: a) 0.002 M Fe(NO3)3 in 1.0 M HNO3 Solution #2 b) 0.002 M KSCN Solution #3 Note: Concentration of reagents used. c) Distilled water 2. Obtain five disposable test tubes and label them 1-5. 3. Dispense the following quantities into the five test tubes: Cuvette No. 0.002 M Fe(NO3)3 Solution #2 3.75 ml 0.002 M KSCN Solution #3 Distilled water 1 0.75 mL 3.00 mL 2 3.75 ml 1.50 mL 2.25 mL 3 3.75 mL 2.25 mL 1.50 mL 4 3.75 mL 3.00 mL 0.75 mL 5 3.75 mL 3.75 mL 0.00 mL 4. Use the glass stir rod to mix each of the solutions in the test tubes. Mix solutions gently to avoidbreaking the test tubes. NOTE: Be sure to rinse and dry the glass rod between solutions. Data Sheet: PART A: Set of Standards to Prepare a Calibration Curve Molar concentration of Fe(NO3)3_ Total Volume: 750ml Molar concentration of KSCN Temperature of one of the standard solutions: 25 C [FeSCN2+] Standard Solution Volume KSCN (mL) [KSCN] (M) Absorbance (M) %T For meter readings only 100 10 Blank 11.50 69.0 1* 2.25 58.8 2 3.00 148.8 3 3.75 42.0 4 4.50 34.4 5 * Calculation for Standard Solution #1 PART B: Absorbance for the Set of Test Solutions, Use to determine Kc Molar concentration of Fe(NO3)3_ Total Volume: 750ml Molar concentration of KSCN_ Temperature of one of the standard solutions: Test Tube# Volume Fe(NO3) 3(mL) [Fe3+] initial (M) C1V1=C2V2 Volume KSCN (mL) [SCN] initial (M) Absorbance, A Percent Transmittance %T (for meter readings only) C1V1=C2V2 1 73.4 59.6 2 47.6 3 34.8 4 31.2 5 PART A: A Set of Standards to Prepare a Calibration Curve Tabulate the following calculated/experimentally determined results: Standard solutions including the blank Volume of KSCN used. Calculated concentration of SCN-expressed as molarity. Calculated concentration of FeSCN2+ expressed as molarity. % Transmittance. Absorbance. Show a sample calculation for the [FeSCN2+] below the printout of your EXCEL workbook. Create a graph of Absorbance vs. [FeSCN2+]: In Excel: You can use the template made during your pre-lab preparation by tweaking it to work with the data! o Give the graph and axes proper titles, including units (use appropriate font sizes). o Make data points visible. o Use inside tick marks for axes. Show the R2 and add a trend line (set the y-intercept to 0). o PART B: Determination of the equilibrium constant, Kc Tabulate the following calculated/experimentally determined results in EXCEL and include this table in your report: Absorbance. Initial concentration of [Fe3+]. Hint: remember to account for the total volume of the solution. Initial concentration of [SCN.]. Hint: remember to account for the total volume of the solution Equilibrium concentration of [Fe 3+] Hint: create an ICE chart using Equation 1 Equilibrium concentration of [SCN-]. Hint: create an ICE chart using Equation 1 Equilibrium concentration of FeSCN2+. Hint: use the trend line equation from the graph of [FeSCN2+] vs. Absorbance. Equilibrium constant. Show a sample calculation for each concentration and the equilibrium constant. Calculate the average and standard deviation for the equilibrium constant. Questions: Include question #1 in your discussion and answer #2 at the end of the discussion showing the calculation and your
Step by Step Solution
There are 3 Steps involved in it

Get step-by-step solutions from verified subject matter experts