

Question: Need help with this I do not understand The histogram to the right represents the weights?of members of a certain?high-school programming team. What is the
Need help with this I do not understand
The histogram to the right represents the weights?of members of a certain?high-school programming team.
What is the class?width? What are the approximate lower and upper class limits of the first?class?
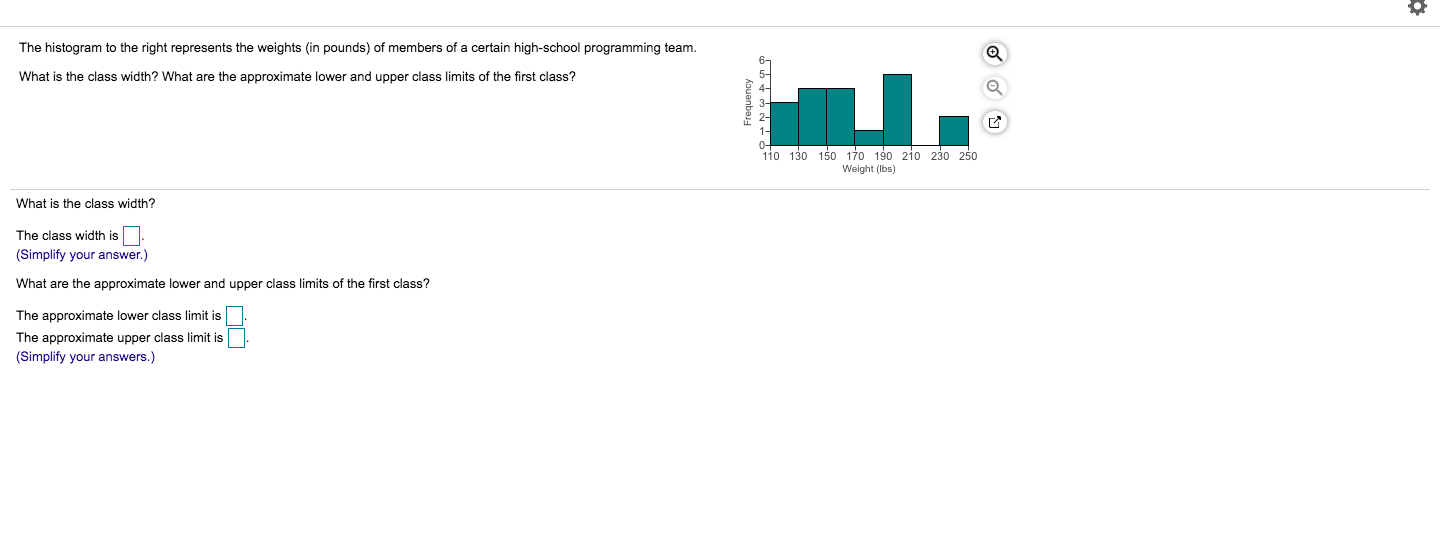
The histogram to the right represents the weights (in pounds) of members of a certain high-school programming team. What is the class width? What are the approximate lower and upper class limits of the first class? Frequency APTNWPEP 110 130 150 170 190 210 230 250 Weight (Ibs) What is the class width? The class width is (Simplify your answer.) What are the approximate lower and upper class limits of the first class? The approximate lower class limit is The approximate upper class limit is (Simplify your answers.)
Step by Step Solution
There are 3 Steps involved in it

Get step-by-step solutions from verified subject matter experts