

Question: Need help with this Non linear inequality and its sign chart? How do i find the real zeros? How do I find the vertical asymptote
Need help with this Non linear inequality and its sign chart? How do i find the real zeros? How do I find the vertical asymptote and where does it occur? How do I find the interval and when I sketch the graph, they gave me a horizontal asymptote y=2 and points (0,-3).
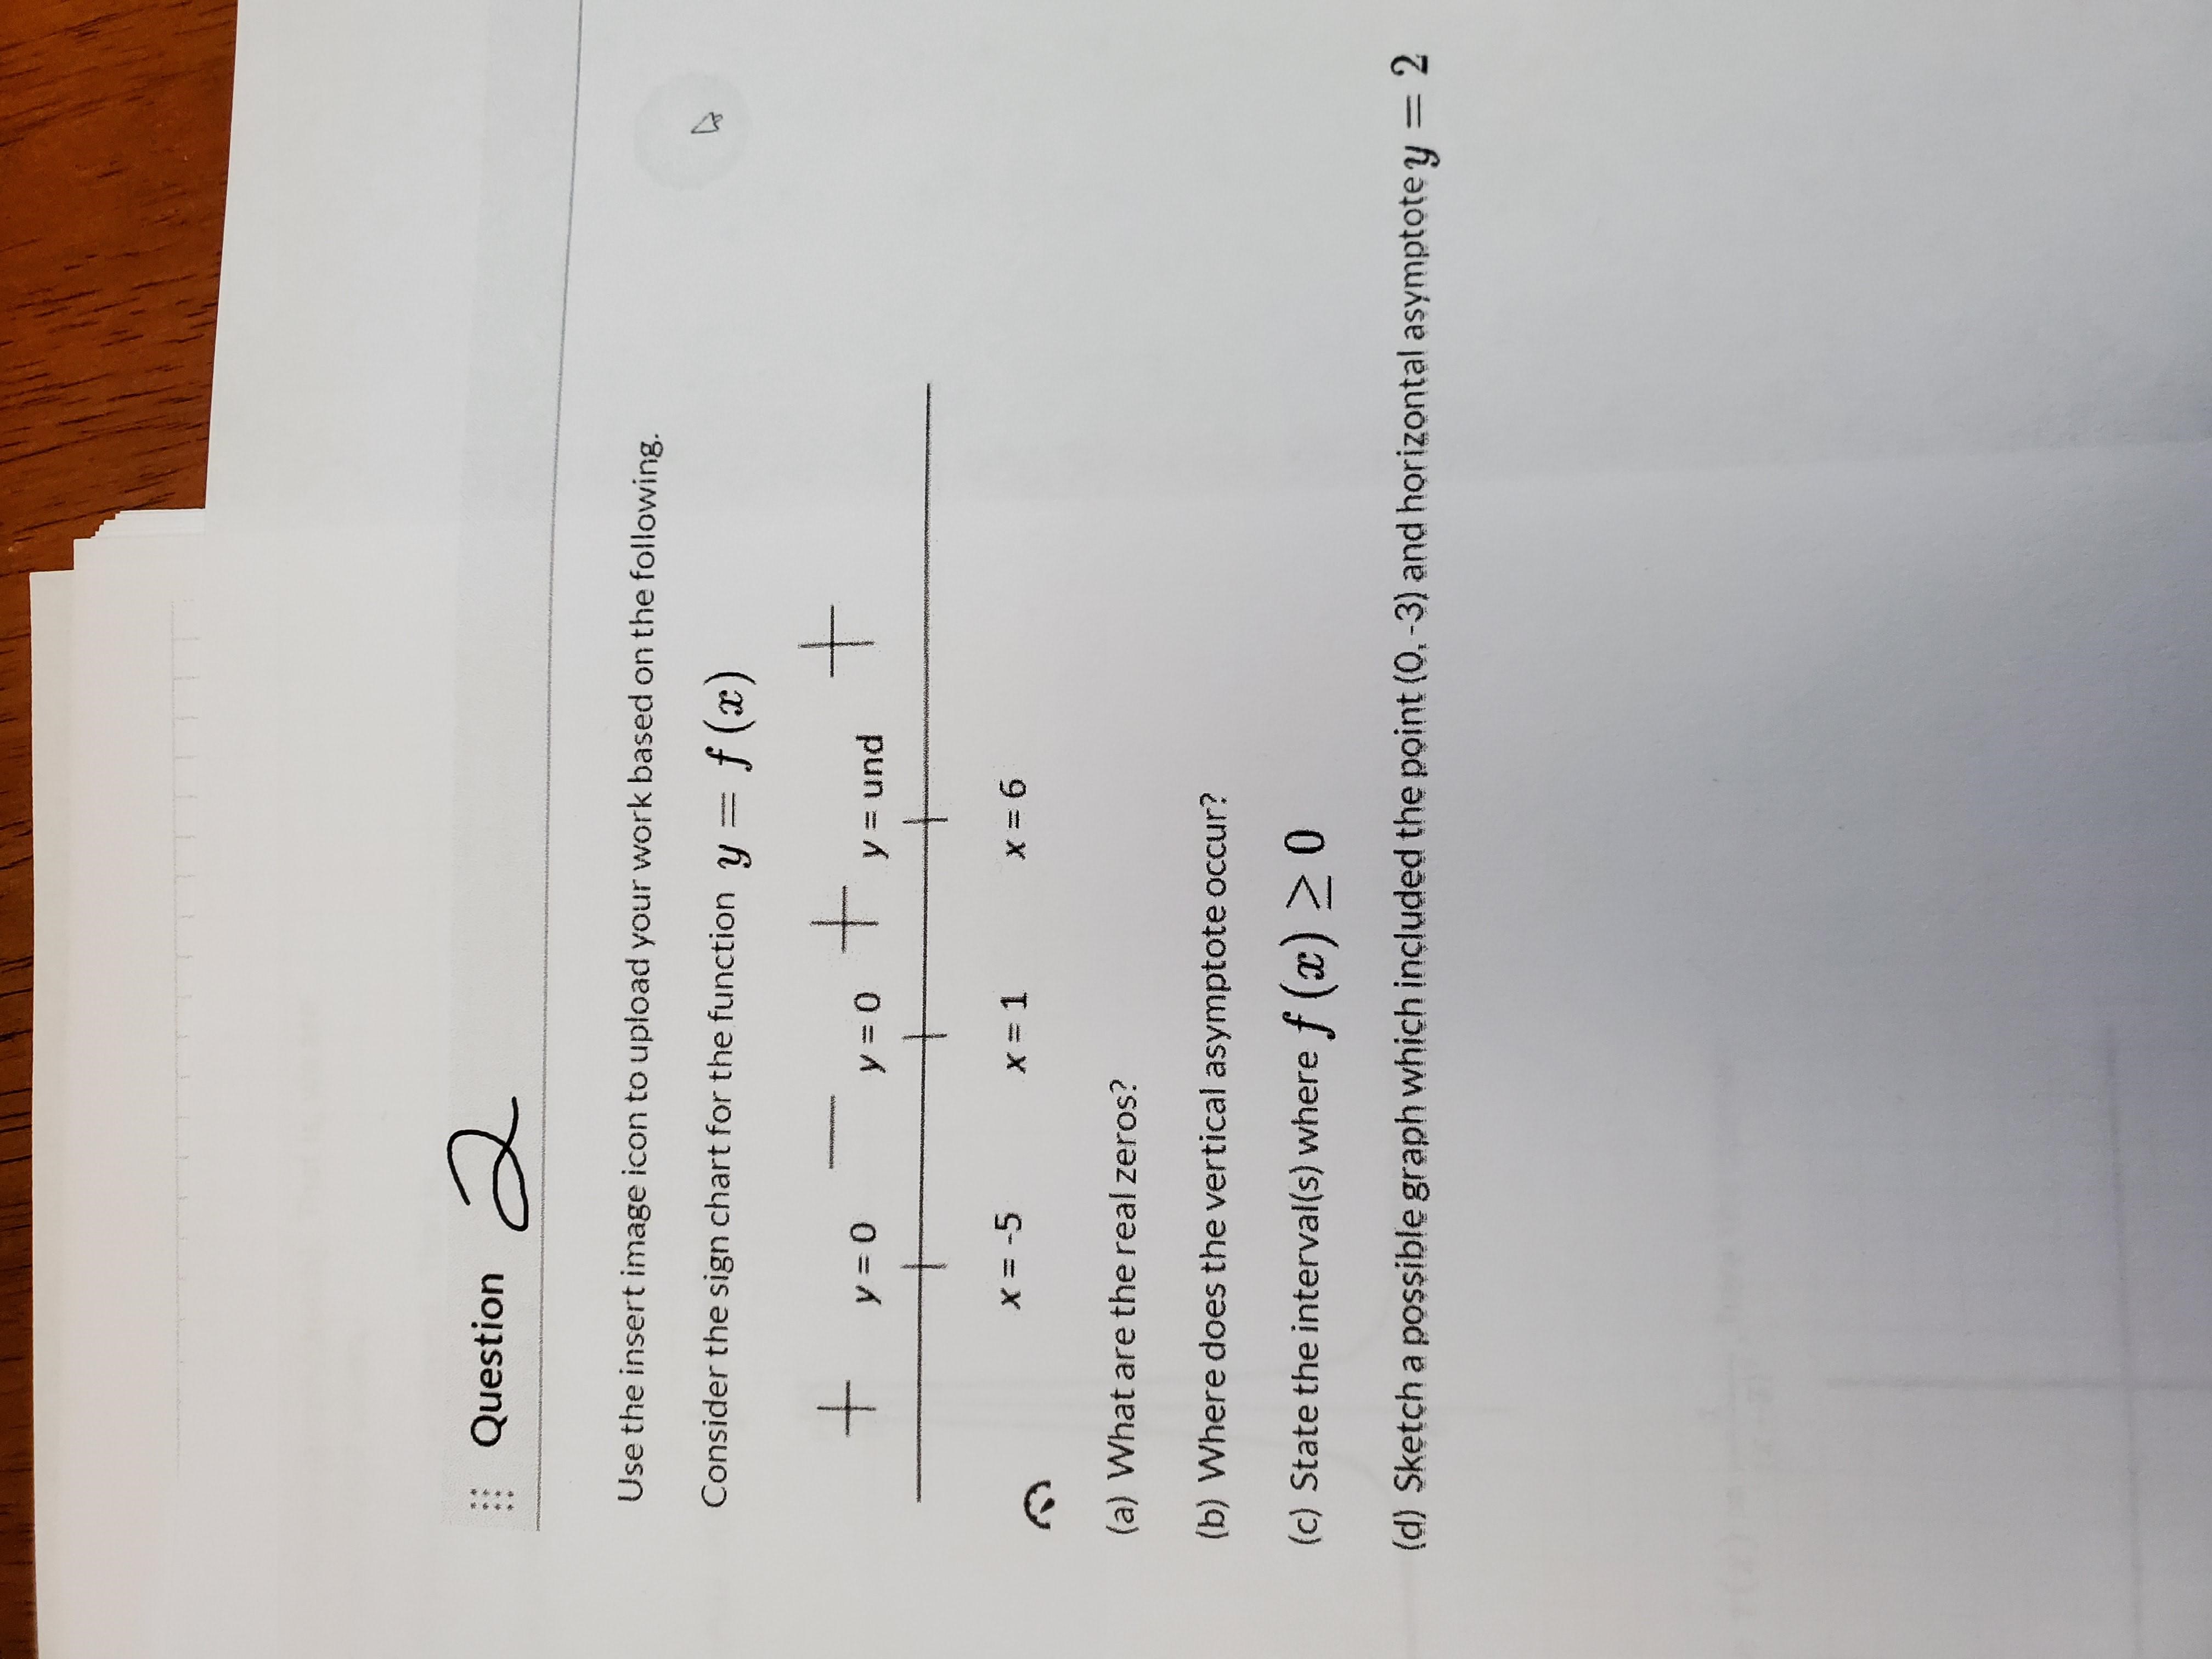
Question Use the insert image icon to upload your work based on the following. Consider the sign chart for the function y = f (x) y = 0 y = o T y= und + X =-5 X = 1 X =6 (a) What are the real zeros? (b) Where does the vertical asymptote occur? (c) State the interval(s) where f (a) _ 0 (d) Sketch a possible graph which included the point (0, -3) and horizontal asymptote y = 2
Step by Step Solution
There are 3 Steps involved in it
1 Expert Approved Answer
Step: 1 Unlock

Question Has Been Solved by an Expert!
Get step-by-step solutions from verified subject matter experts
Step: 2 Unlock
Step: 3 Unlock