Question: need help with this please a. Start Word, then open the file IL_INT_3-3.docx from the location where you store your Data Files, then save it
need help with this please
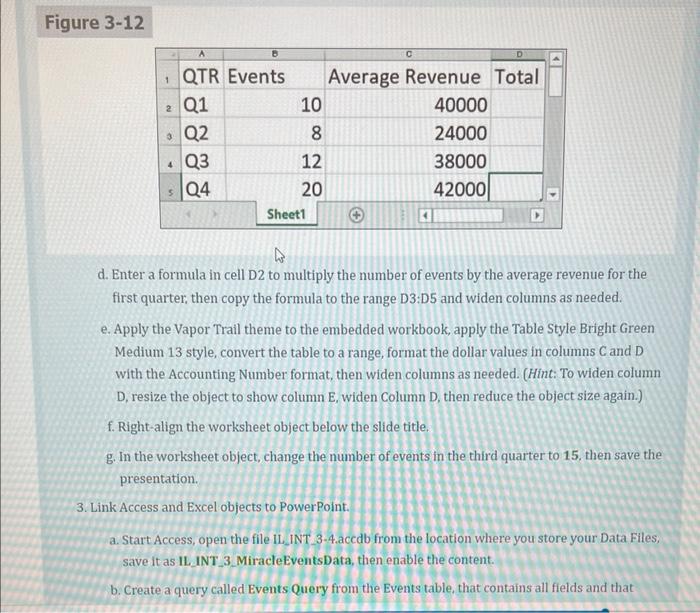
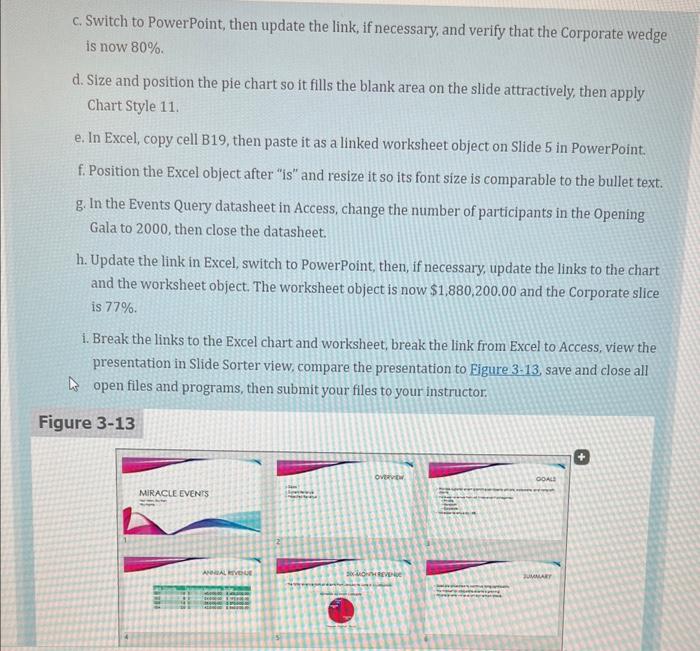
a. Start Word, then open the file IL_INT_3-3.docx from the location where you store your Data Files, then save it as IL_INT_3_MiracleEvents0utline. b. Switch to Outline view, then demote the body text "Your Vision, Our Plan" to Level 2. c. Demote the three subheadings: "Private," "Nonprofit," and "Corporate" to Level 3. d. Promote the Six-Month Revenue subheading to Level 1, then save and close the document. e. Open a blank presentation in PowerPoint, then save it as IL_INT_3_MiracleEventsPresentation in the location where you store your Data Files. f. Import the IL_INT_3_MiracleEventsOutline document as slides into PowerPoint. g. Delete the blank Slide 1, apply the Title Slide layout to the new Slide 1, then add your name after the subtitle on Slide 1. h. Apply the Vapor Trail theme with the pink variant (third variant from the left). 1. Switch to Slide Sorter view, select all the slides, reset the layout, then save the presentation. 2. Embed an Excel worksheet in PowerPoint. a. Switch to Normal view, move to Slide 4 , delete the blank text placeholder, then insert a Microsoft Excel Worksheet object. b. Resize the object so only columns A to D and rows 1 to 5 are visible. c. Change the font size of all the cells to 28 point, enter labels and values as shown in Eigure 3 . 12. then adjust column widths and the size of the worksheet object as needed. Figure 3-12 d. Enter a formula in cell D2 to multiply the number of events by the average revenue for the first quarter, then copy the formula to the range D3:D5 and widen columns as needed. e. Apply the Vapor Trail theme to the embedded workbook, apply the Table Style Bright Green Medium 13 style, convert the table to a range, format the dollar values in columns C and D with the Accounting Number format, then widen columns as needed. (Hint: To widen column D, resize the object to show column E, widen Column D, then reduce the object size again.) f. Right-align the worksheet object below the slide title. g. In the worksheet object, change the number of events in the third quarter to 15 , then save the presentation. 3. Link Access and Excel objects to PowerPoint. a. Start Access, open the file IL_INT 3-4.acedb from the location where you store your Data Files, save it as IL_INT_3_MiracleEventsData, then enable the content. b. Create a query called Events Query from the Events table, that contains all fields and that b. Create a query called Events Query from the Events table, that contains all fields and that sorts the contents of the Category field in ascending order. (Hint: Remember to sort the Category field in Design view.) c. Close and save the query, copy it, create a new workbook in Excel, then paste the query datasheet as a link into cell A1. d. Format the values in column F using the Accounting Number format, widen columns as necessary, enter Total in cell G1, enter the formula in cell G2 to multiply the Participants by the Per Person cost, then copy the formula to the range G3:G16 and widen the column as necessary. e. In the range B18:D19, enter labels and formulas to calculate the total revenue from all the events in each of the three categories: Corporate, Nonprofit, and Private, widen columns as needed, then save the workbook as IL_INT 3_MiracleEventsRevenue. f. Create a pie chart in the first 2D style from the range B18:D19, then apply Quick Layout 1 and move the chart to the right of the data. g. Change the chart title to Revenue by Event Category, copy the chart, then paste it on Slide 5 in the PowerPoint presentation using the Use Destination Theme \& Link Data option. h. Move the worksheet object below the bullet point, then add a black outline. 4. Manage links. a. In the Access query, change the per person cost for the Product Launch to $150.00, then close the query. b. Switch to Excel, then update the link in the Edit Links dialog box if the value in cell F2 does not automatically update to $150.00. c. Switch to PowerPoint, then update the link, if necessary, and verify that the Corporate wedge is now 80%. d. Size and position the pie chart so it fills the blank area on the slide attractively, then apply Chart Style 11. e. In Excel, copy cell B19, then paste it as a linked worksheet object on Slide 5 in PowerPoint. f. Position the Excel object after "is" and resize it so its font size is comparable to the bullet text. g. In the Events Query datasheet in Access, change the number of participants in the Opening Gala to 2000, then close the datasheet. h. Update the link in Excel, switch to PowerPoint, then, if necessary, update the links to the chart and the worksheet object. The worksheet object is now $1,880,200.00 and the Corporate slice is 77%. 1. Break the links to the Excel chart and worksheet, break the link from Excel to Access, view the presentation in Slide Sorter view, compare the presentation to Eigure 3-13, save and close all open files and programs, then submit your files to your instructor


