

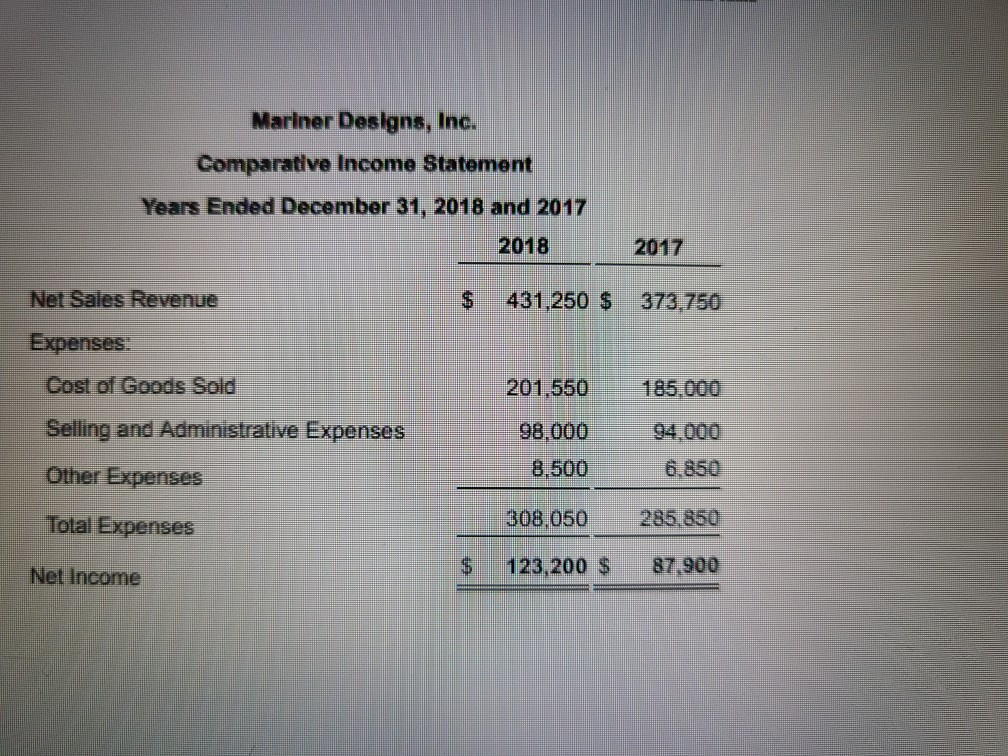
Question: need help with this problem Mariner Designs, Inc. Comparative Income Statement Years Ended December 31, 2018 and 2017 2018 Net Sales Revenue 431,250 $ 373.750

need help with this problem
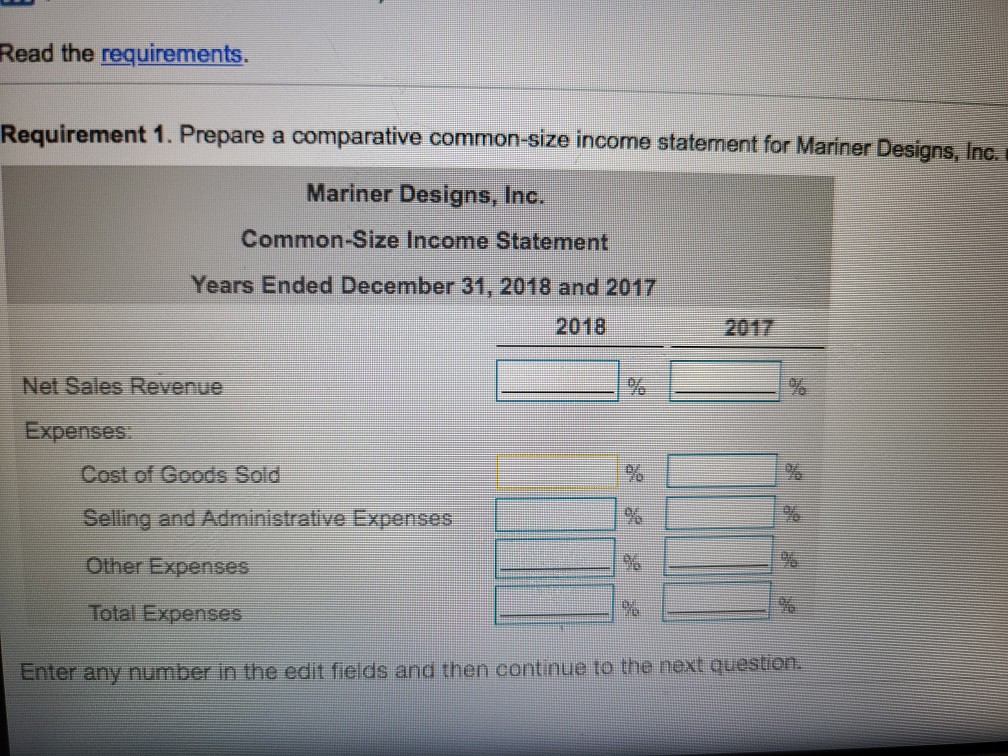
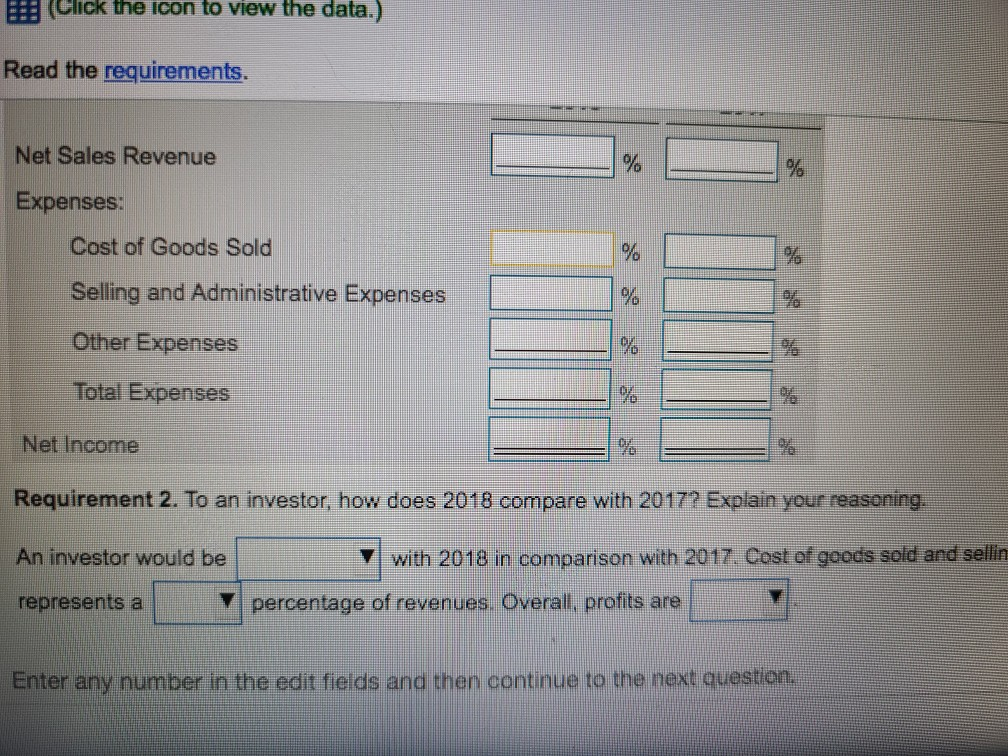
Mariner Designs, Inc. Comparative Income Statement Years Ended December 31, 2018 and 2017 2018 Net Sales Revenue 431,250 $ 373.750 Expenses Cost of Goods Sold 201,550 185.000 Selling and Administrative Expenses 98.000 8.500 Other Expenses Total Expenses 308.050 285,850 Net Income 123,200 $ 87,900 Read the requirements. Requirement 1. Prepare a comparative common-size income statement for Mariner Designs, Inc. Mariner Designs, Inc. Common-Size Income Statement Years Ended December 31, 2018 and 2017 2018 2017 Net Sales Revenue Expenses Cost of Goods Sold Selling and Administrative Expenses Other Expenses Total Expenses Enter any number in the edit fields and then continue to the next question. 02: (Click the icon to view the data.) Read the requirements. Net Sales Revenue % 96 Expenses: Cost of Goods Sold % Selling and Administrative Expenses % Other Expenses % Total Expenses Net Income 9 Requirement 2. To an investor, how does 2018 compare with 2017? Explain your reasoning. An investor would be with 2018 in comparison with 2017. Cost of goods sold and sellin represents a percentage of revenues. Overall, profits are Enter any number in the edit fields and then continue to the next question. elling and general expensesthe two largest expenses-consumed percentages of net revenue in 2018 and net income
Step by Step Solution
There are 3 Steps involved in it

Get step-by-step solutions from verified subject matter experts