

Question: Need help with this question. I attached image for assistance The accompanying data represent the number of days absent, x, and the final exam score,
Need help with this question. I attached image for assistance
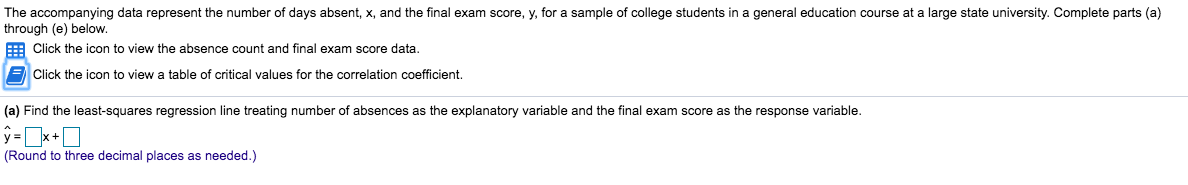
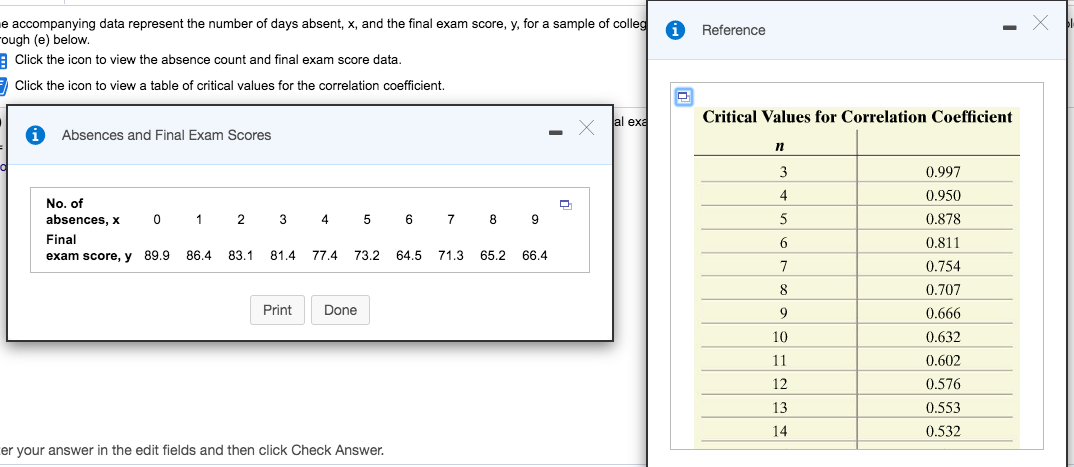
The accompanying data represent the number of days absent, x, and the final exam score, y, for a sample of college students in a general education course at a large state university. Complete parts (a) through (e) below. Click the icon to view the absence count and final exam score data. Click the icon to view a table of critical values for the correlation coefficient. (a) Find the least-squares regression line treating number of absences as the explanatory variable and the final exam score as the response variable. y = _*+0 (Round to three decimal places as needed.)e accompanying data represent the number of days absent, x, and the final exam score, y, for a sample of college ough (e) below. i Reference X Click the icon to view the absence count and final exam score data. Click the icon to view a table of critical values for the correlation coefficient. Critical Values for Correlation Coefficient Absences and Final Exam Scores X al exa n 0.997 No. of 0.950 absences, x 0 1 2 3 4 5 6 7 8 9 0.878 Final exam score, y 89.9 86.4 83.1 81.4 77.4 73.2 64.5 71.3 65.2 66.4 0.811 0.754 8 0.707 Print Done 0.666 10 0.632 11 0.602 12 0.576 13 0.553 14 0.532 er your answer in the edit fields and then click Check
Step by Step Solution
There are 3 Steps involved in it

Get step-by-step solutions from verified subject matter experts