

Question: need help with this question The given data represent the number of people from a town, aged 25-64, who subscribe to a certain print magazine.
need help with this question 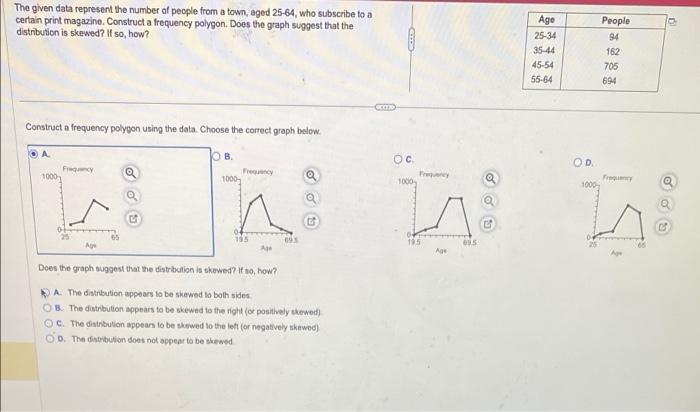
The given data represent the number of people from a town, aged 25-64, who subscribe to a certain print magazine. Construct a frequency polygon. Does the graph suggest that the distribution is skewed? If so, how? Construct a frequency polygon using the data. Choose the correct graph below. Does the graph suggest that the distribulion is skewed? If ao, how? A. The distribution appears to be skewed to both sides. B. The distribution appears to be skewed to the night ( posithely shewed) c. The disintustion appean to be showed to the lett (or negatively shewed). D. The distribution does not appear to be skewed
Step by Step Solution
There are 3 Steps involved in it
1 Expert Approved Answer
Step: 1 Unlock

Question Has Been Solved by an Expert!
Get step-by-step solutions from verified subject matter experts
Step: 2 Unlock
Step: 3 Unlock