

Question: Would appreciate your help The given data represent the number of people from a town, aged 25-64, who subscribe to a certain print magazine. Construct
Would appreciate your help
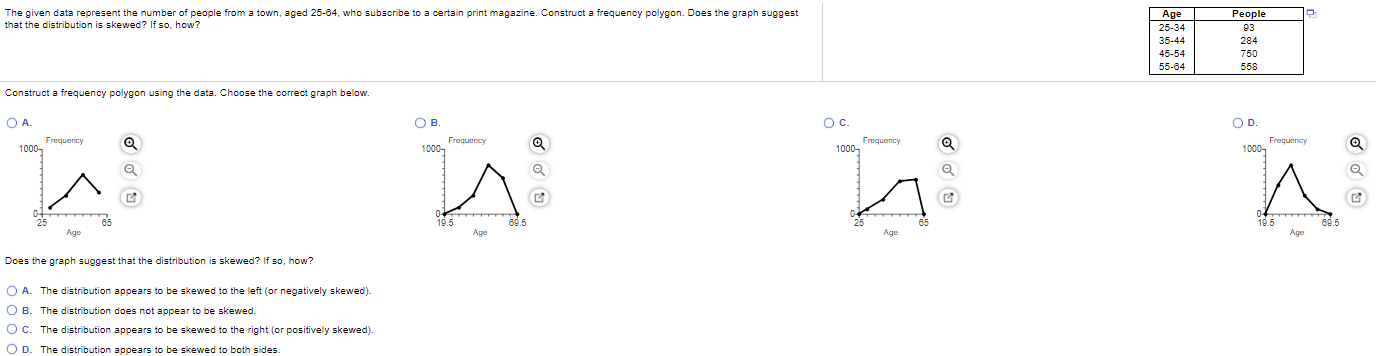
The given data represent the number of people from a town, aged 25-64, who subscribe to a certain print magazine. Construct a frequency polygon. Does the graph suggest Age People that the distribution is skewed? If so, how? 25-34 93 35-44 284 45-54 750 55-64 558 Construct a frequency polygon using the data. Choose the correct graph below. O A. O B. O C. OD. Frequency Frequency Frequency Frequency 1000- 1000- 1000- Q 1000- 25 19.5 60.5 25 85 10.5 60.5 Age Age Age Age Does the graph suggest that the distribution is skewed? If so, how? O A. The distribution appears to be skewed to the left (or negatively skewed). O B. The distribution does not appear to be skewed. O C. The distribution appears to be skewed to the right (or positively skewed). O D. The distribution appears to be skewed to both sides
Step by Step Solution
There are 3 Steps involved in it

Get step-by-step solutions from verified subject matter experts