

Question: Need help with this question...I attached the data chart and table for assistance. For the accompanying data set, (a) draw a scatter diagram of the
Need help with this question...I attached the data chart and table for assistance.
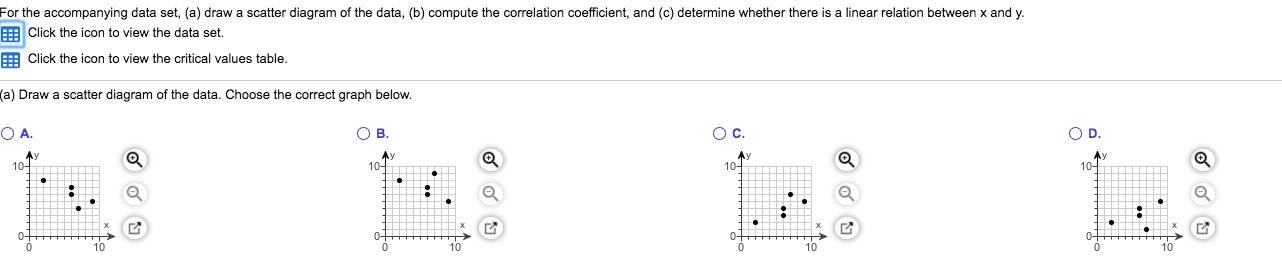
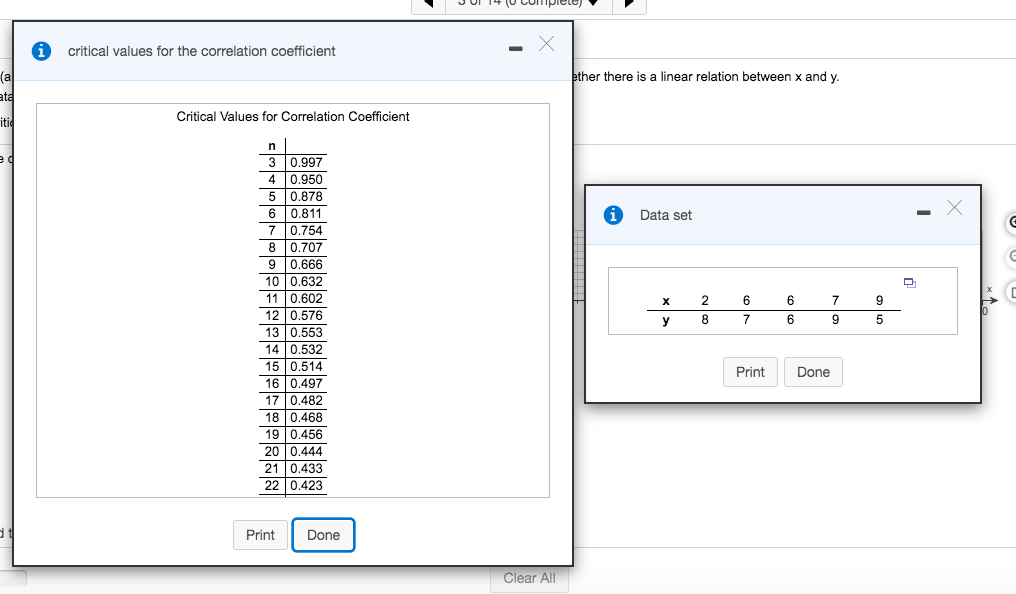
For the accompanying data set, (a) draw a scatter diagram of the data, (b) compute the correlation coefficient, and (c) determine whether there is a linear relation between x and y. Click the icon to view the data set. Click the icon to view the critical values table. a) Draw a scatter diagram of the data. Choose the correct graph below. O A. O B. O c. OD. 10- 10- Ay 10- 10- 10 10 10i critical values for the correlation coefficient - X a ether there is a linear relation between x and y. tal itid Critical Values for Correlation Coefficient n 3 0.997 4 0.950 5 0.878 6 0.811 i Data set - X 7 0.754 8 0.707 9 0.666 10 0.632 11 0.602 X 6 12 0.576 V 8 6 9 13 0.553 14 0.532 15 0.514 Print Done 16 0.497 17 0.482 18 0.468 19 0.456 20 0.444 21 0.433 22 0.423 Print Done Clear All
Step by Step Solution
There are 3 Steps involved in it

Get step-by-step solutions from verified subject matter experts