

Question: please solve in excel and show step by step instructions. Heavenly Chocolates manufactures and sells quality chocolate products at its plant and retail store located
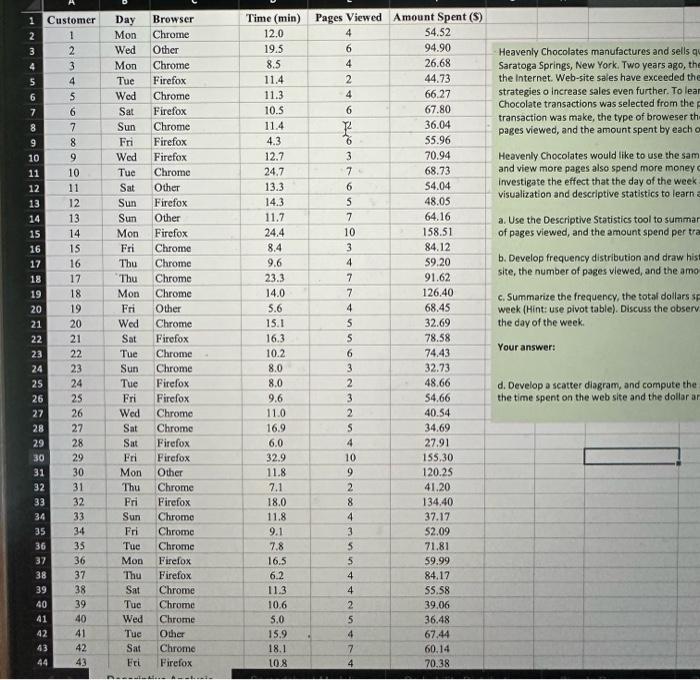
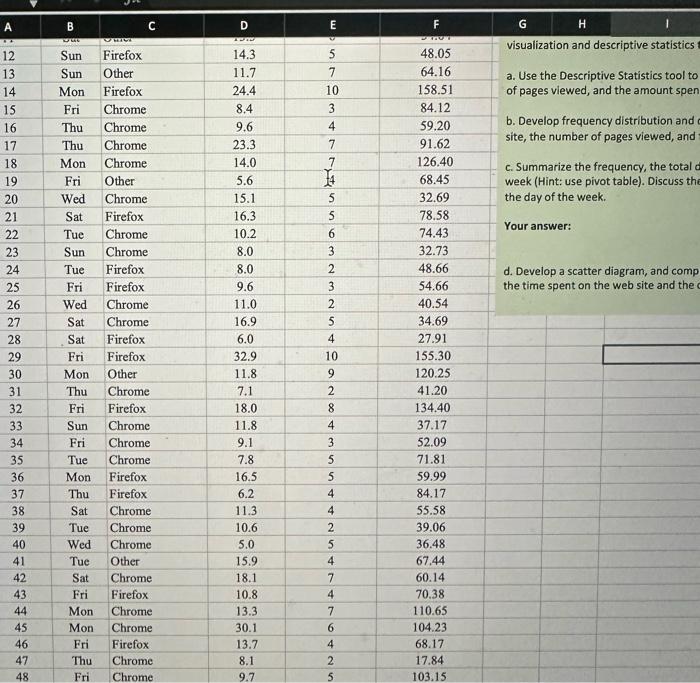
Heavenly Chocolates manufactures and sells quality chocolate products at its plant and retail store located in Saratoga Springs, New York. Two years ago, the company developed a web site and began selling its products over the Internet. Web-site sales have exceeded the company's expectations, and management is now considering strategies o increase sales even further. To learn more about the web-site customers, a sample of 50 Heavenly Chocolate transactions was selected from the previous month's sales. Data showing the day of the week each transaction was make, the type of broweser the customer used, the time spent on the web-site, the number of web pages viewed, and the amount spent by each of the 50 customers are contained in the excel template file. Heavenly Chocolates would like to use the sample data to determine whether online shoppers who spend more time and view more pages also spend more money during their visit to the website. The company would also like to investigate the effect that the day of the week and the type of brower have on sales. Use the methods of data visualization and descriptive statistics to learn about the customers who visit the Heavenly Chocolates website. a. Use the Descriptive Statistics tool to summarize the length of time the shopper spends on the web site, the number of pages viewed, and the amount spend per transaction. b. Develop frequency distribution and draw histogram chart for the length of time the shopper spends on the web site, the number of pages viewed, and the amount spend per transaction. c. Summarize the frequency, the total dollars spent, and the mean amount spent per transaction for each day of week (Hint: use pivot table). Discuss the observations you can make about Heavenly Chocolates' business based on the day of the week. Your answer: d. Develop a scatter diagram, and compute the sample correlation coefficient to explore the relationship between the time spent on the web site and the dollar amount spent. Heavenly Chocolates manufactures and sells q Saratoga Springs, New York. Two years ago, th the Internet. Web-site sales have exceeded the strategies o increase sales even further. To lear Chocolate transactions was selected from the transaction was make, the type of broweser th pages viewed, and the amount spent by each o Heavenly Chocolates would like to use the sam and view more pages also spend more money investigate the effect that the day of the week visualization and descriptive statistics to learn a. Use the Descriptive Statistics tool to summar of pages viewed, and the amount spend per tra b. Develop frequency distribution and draw his site, the number of pages vlewed, and the amo c. Summarize the frequency, the total dollars week (Hint: use pivot table). Discuss the observ the day of the week. Your answer: d. Develop a scatter diagram, and compute the the time spent on the web site and the dollar ar visualization and descriptive statistics a. Use the Descriptive Statistics tool to of pages viewed, and the amount spen b. Develop frequency distribution and site, the number of pages viewed, and c. Summarize the frequency, the total week (Hint: use pivot table). Discuss the the day of the week. Your answer: d. Develop a scatter diagram, and comp the time spent on the web site and the c
Step by Step Solution
There are 3 Steps involved in it

Get step-by-step solutions from verified subject matter experts