

Question: need help with this r code 14 16. #NH step 8) (10 points) Starting with data set NYC, find the percentage of flights each month
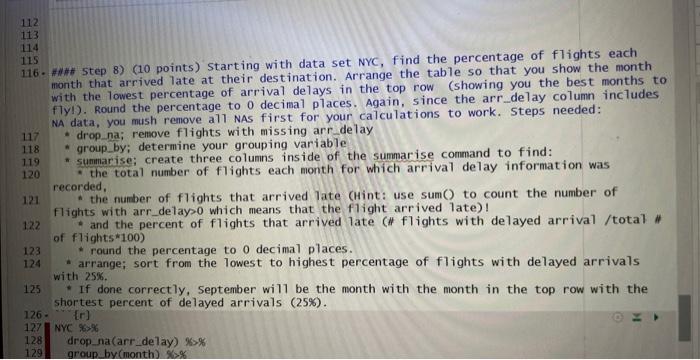
14 16. \#NH step 8) (10 points) Starting with data set NYC, find the percentage of flights each month that arrived late at their destination. Arrange the table so that you show the month with the lowest percentage of arrival delays in the top row (showing you the best months to fly!). Round the percentage to 0 decimal places. Again, since the arr delay column includes NA data, you mush remove a11 NAs first for your calculations to work. Steps needed: drop_na; remove flights with missing arr_delay - group by; determine your grouping variable - summarise; create three columins inside of the summarise command to find: * the total number of flights each month for which arrival delay information was recorded, " the number of flights that arrived late (Hint: use sum() to count the number of flights with arr_delay>0 which means that the flight arrived late)! * and the percent of flights that arrived late (\# flights with delayed arrival /total \# of flights * 100 ) * round the percentage to 0 decimal places. - arrange; sort from the lowest to highest percentage of flights with delayed arrivals with 25%. * If done correctly, september will be the month with the month in the top row with the shortest percent of delayed arrivals (25\%)
Step by Step Solution
There are 3 Steps involved in it

Get step-by-step solutions from verified subject matter experts