

Question: need help with this r code 91 92 93. ###N Step 7) (10 points) Starting with data set NYC, create a new column to calculate
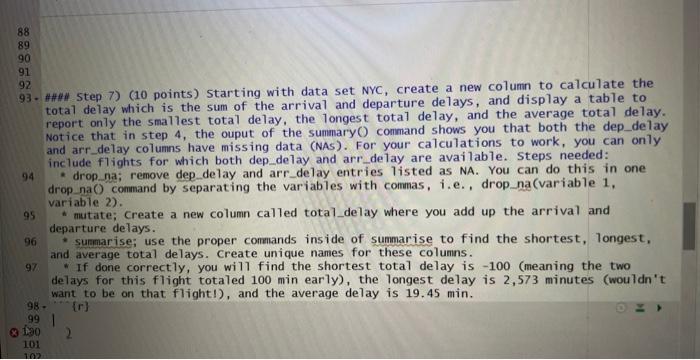
91 92 93. \#\#\#N Step 7) (10 points) Starting with data set NYC, create a new column to calculate the total delay which is the sum of the arrival and departure delays, and display a table to report only the smallest total delay, the longest total delay, and the average total delay. Notice that in step 4 , the ouput of the summary O command shows you that both the dep delay and arrdelay columns have missing data (NAs). For your calculations to work, you can only include flights for which both dep_delay and arr_delay are available. Steps needed: 94 * drop_na; remove dep_delay and arr_delay entries listed as NA. You can do this in one drop naO) command by separating the variables with commas, i.e., drop na(variable 1 , variable 2). 95 " mutate; Create a new column called tota7_delay where you add up the arrival and departure delays. 96 - sumarise; use the proper conmands inside of summarise to find the shortest, longest, and average total delays. Create unique names for these columns. 97. If done correctly, you wi 17 find the shortest total delay is 100 (meaning the two delays for this flight totaled 100 min early), the longest delay is 2,573 minutes (wouldn't want to be on that flight!), and the average delay is 19.45min
Step by Step Solution
There are 3 Steps involved in it

Get step-by-step solutions from verified subject matter experts