

Question: Need help with which options to choose A variation in 'Paid Fairly' and 'Work I Want' can explain 1.84% variation in Performance, and remaining 98.16%

Need help with which options to choose
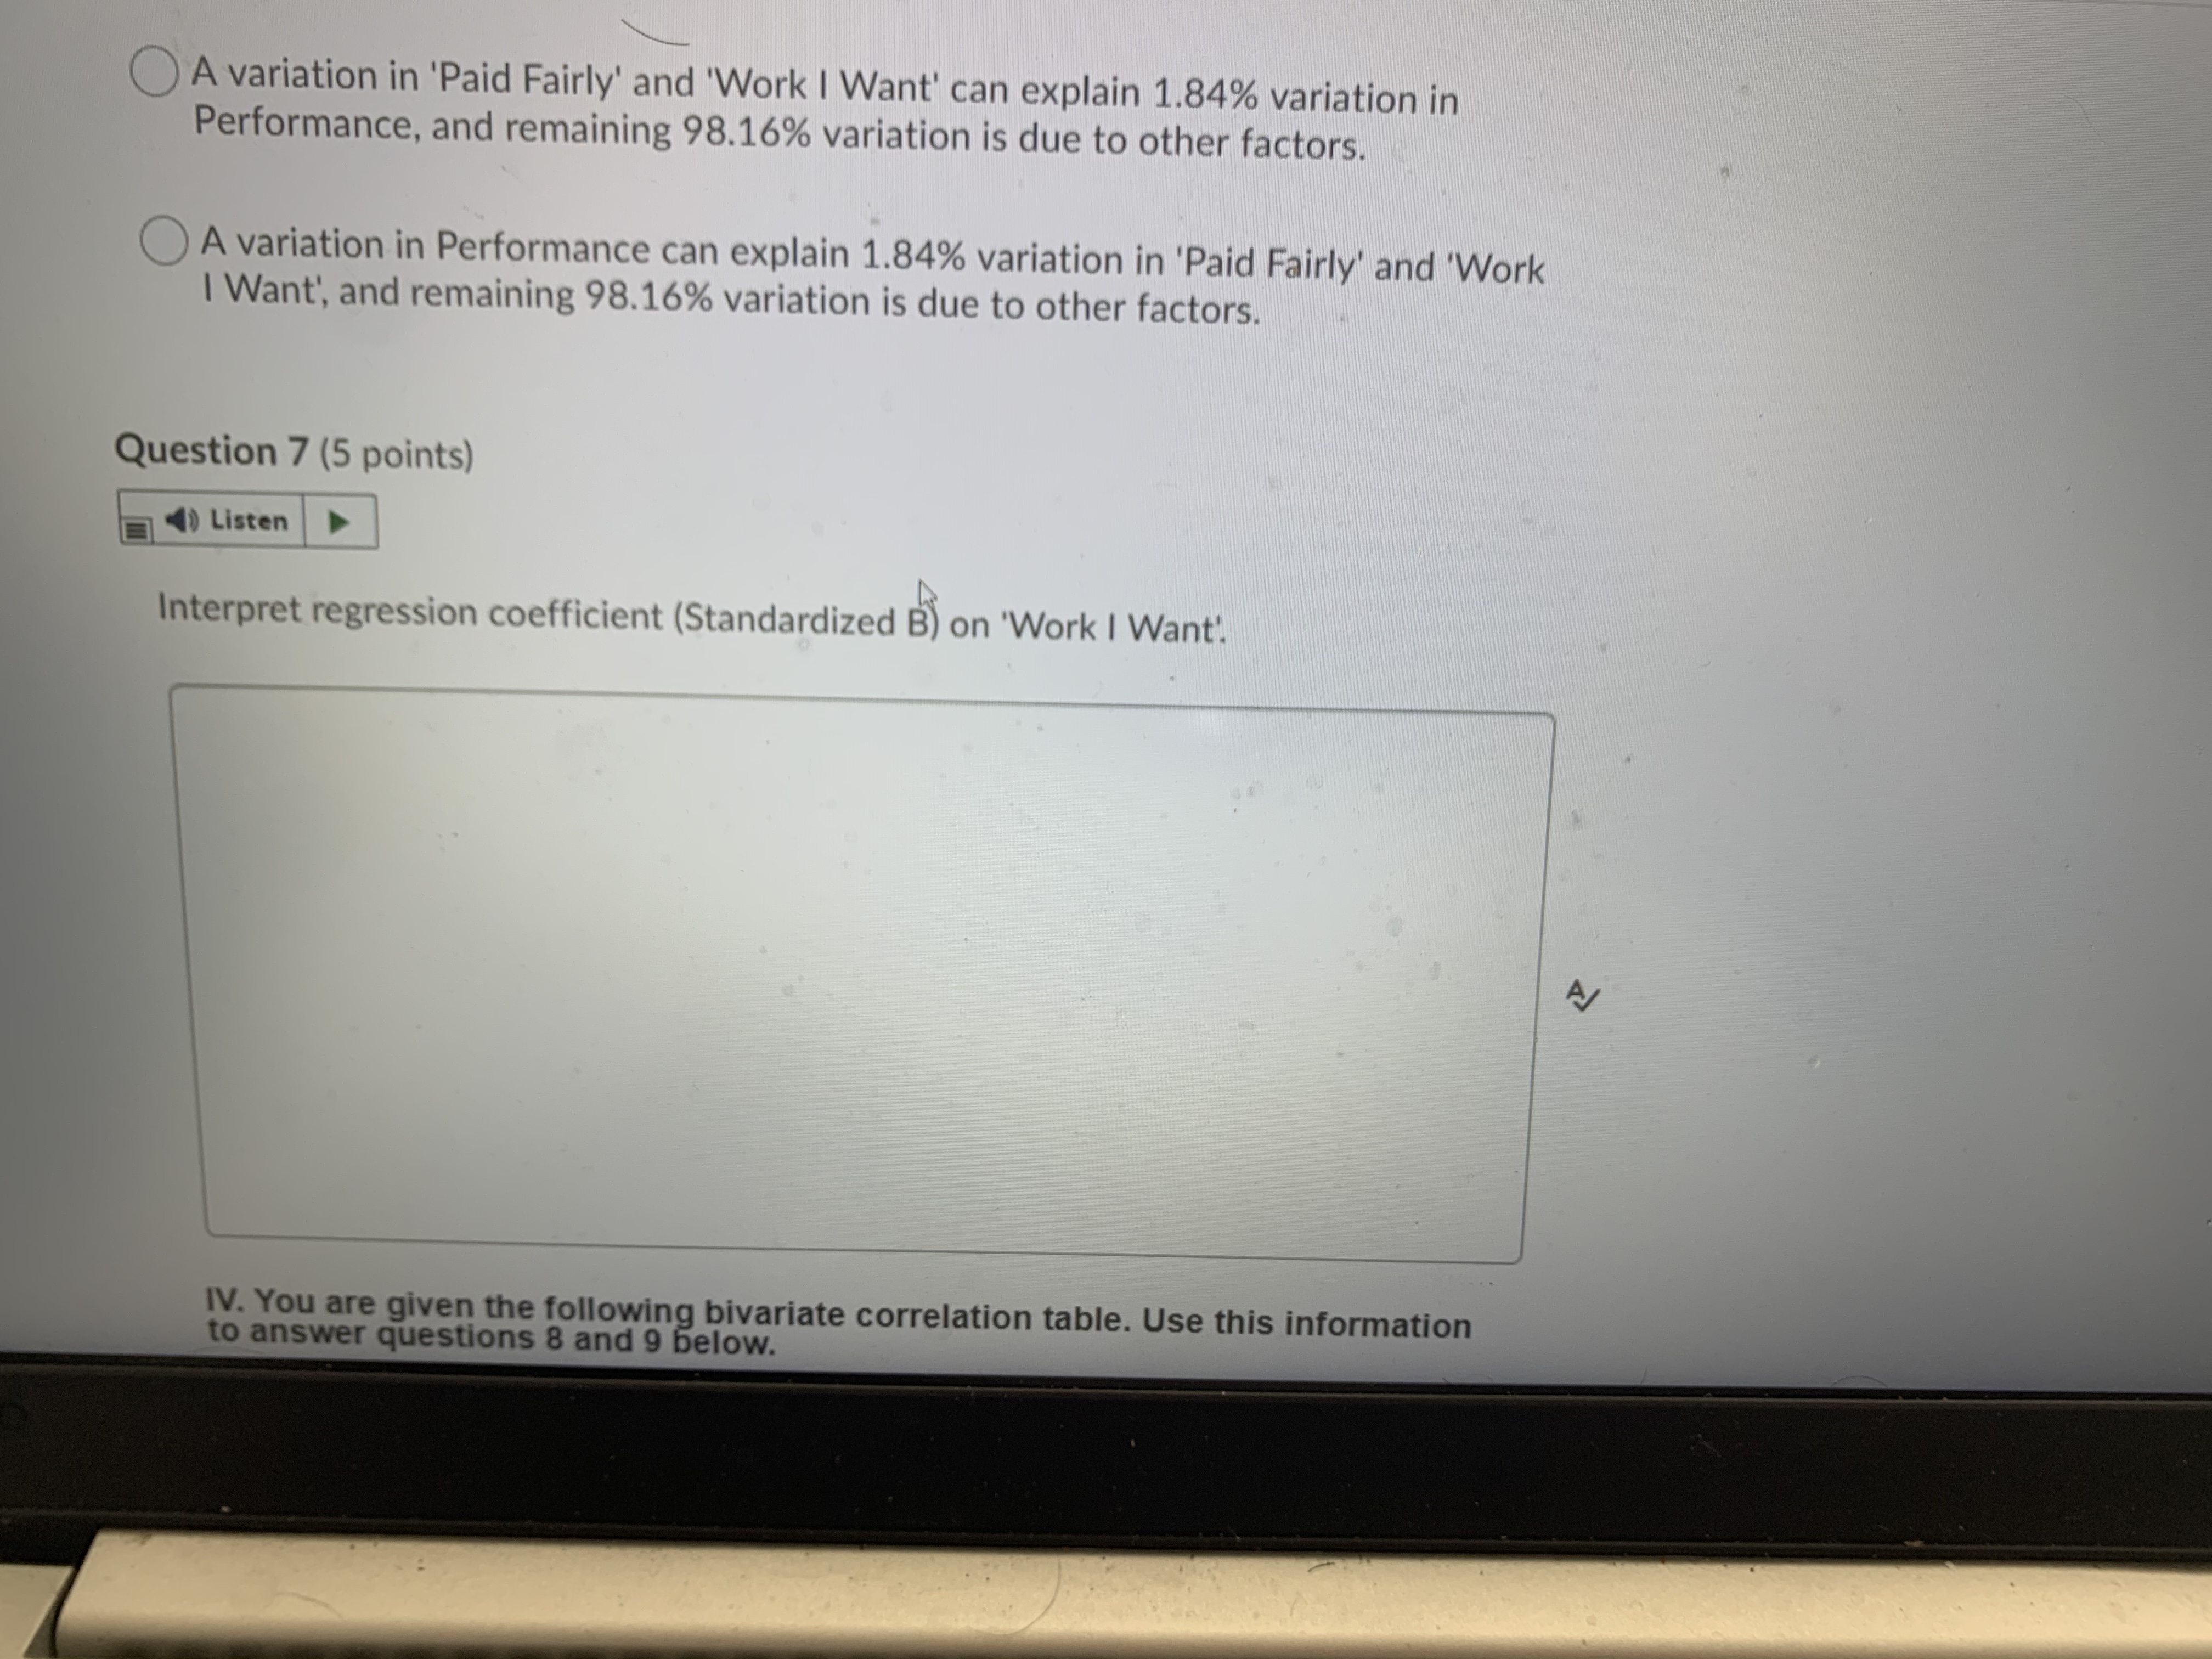
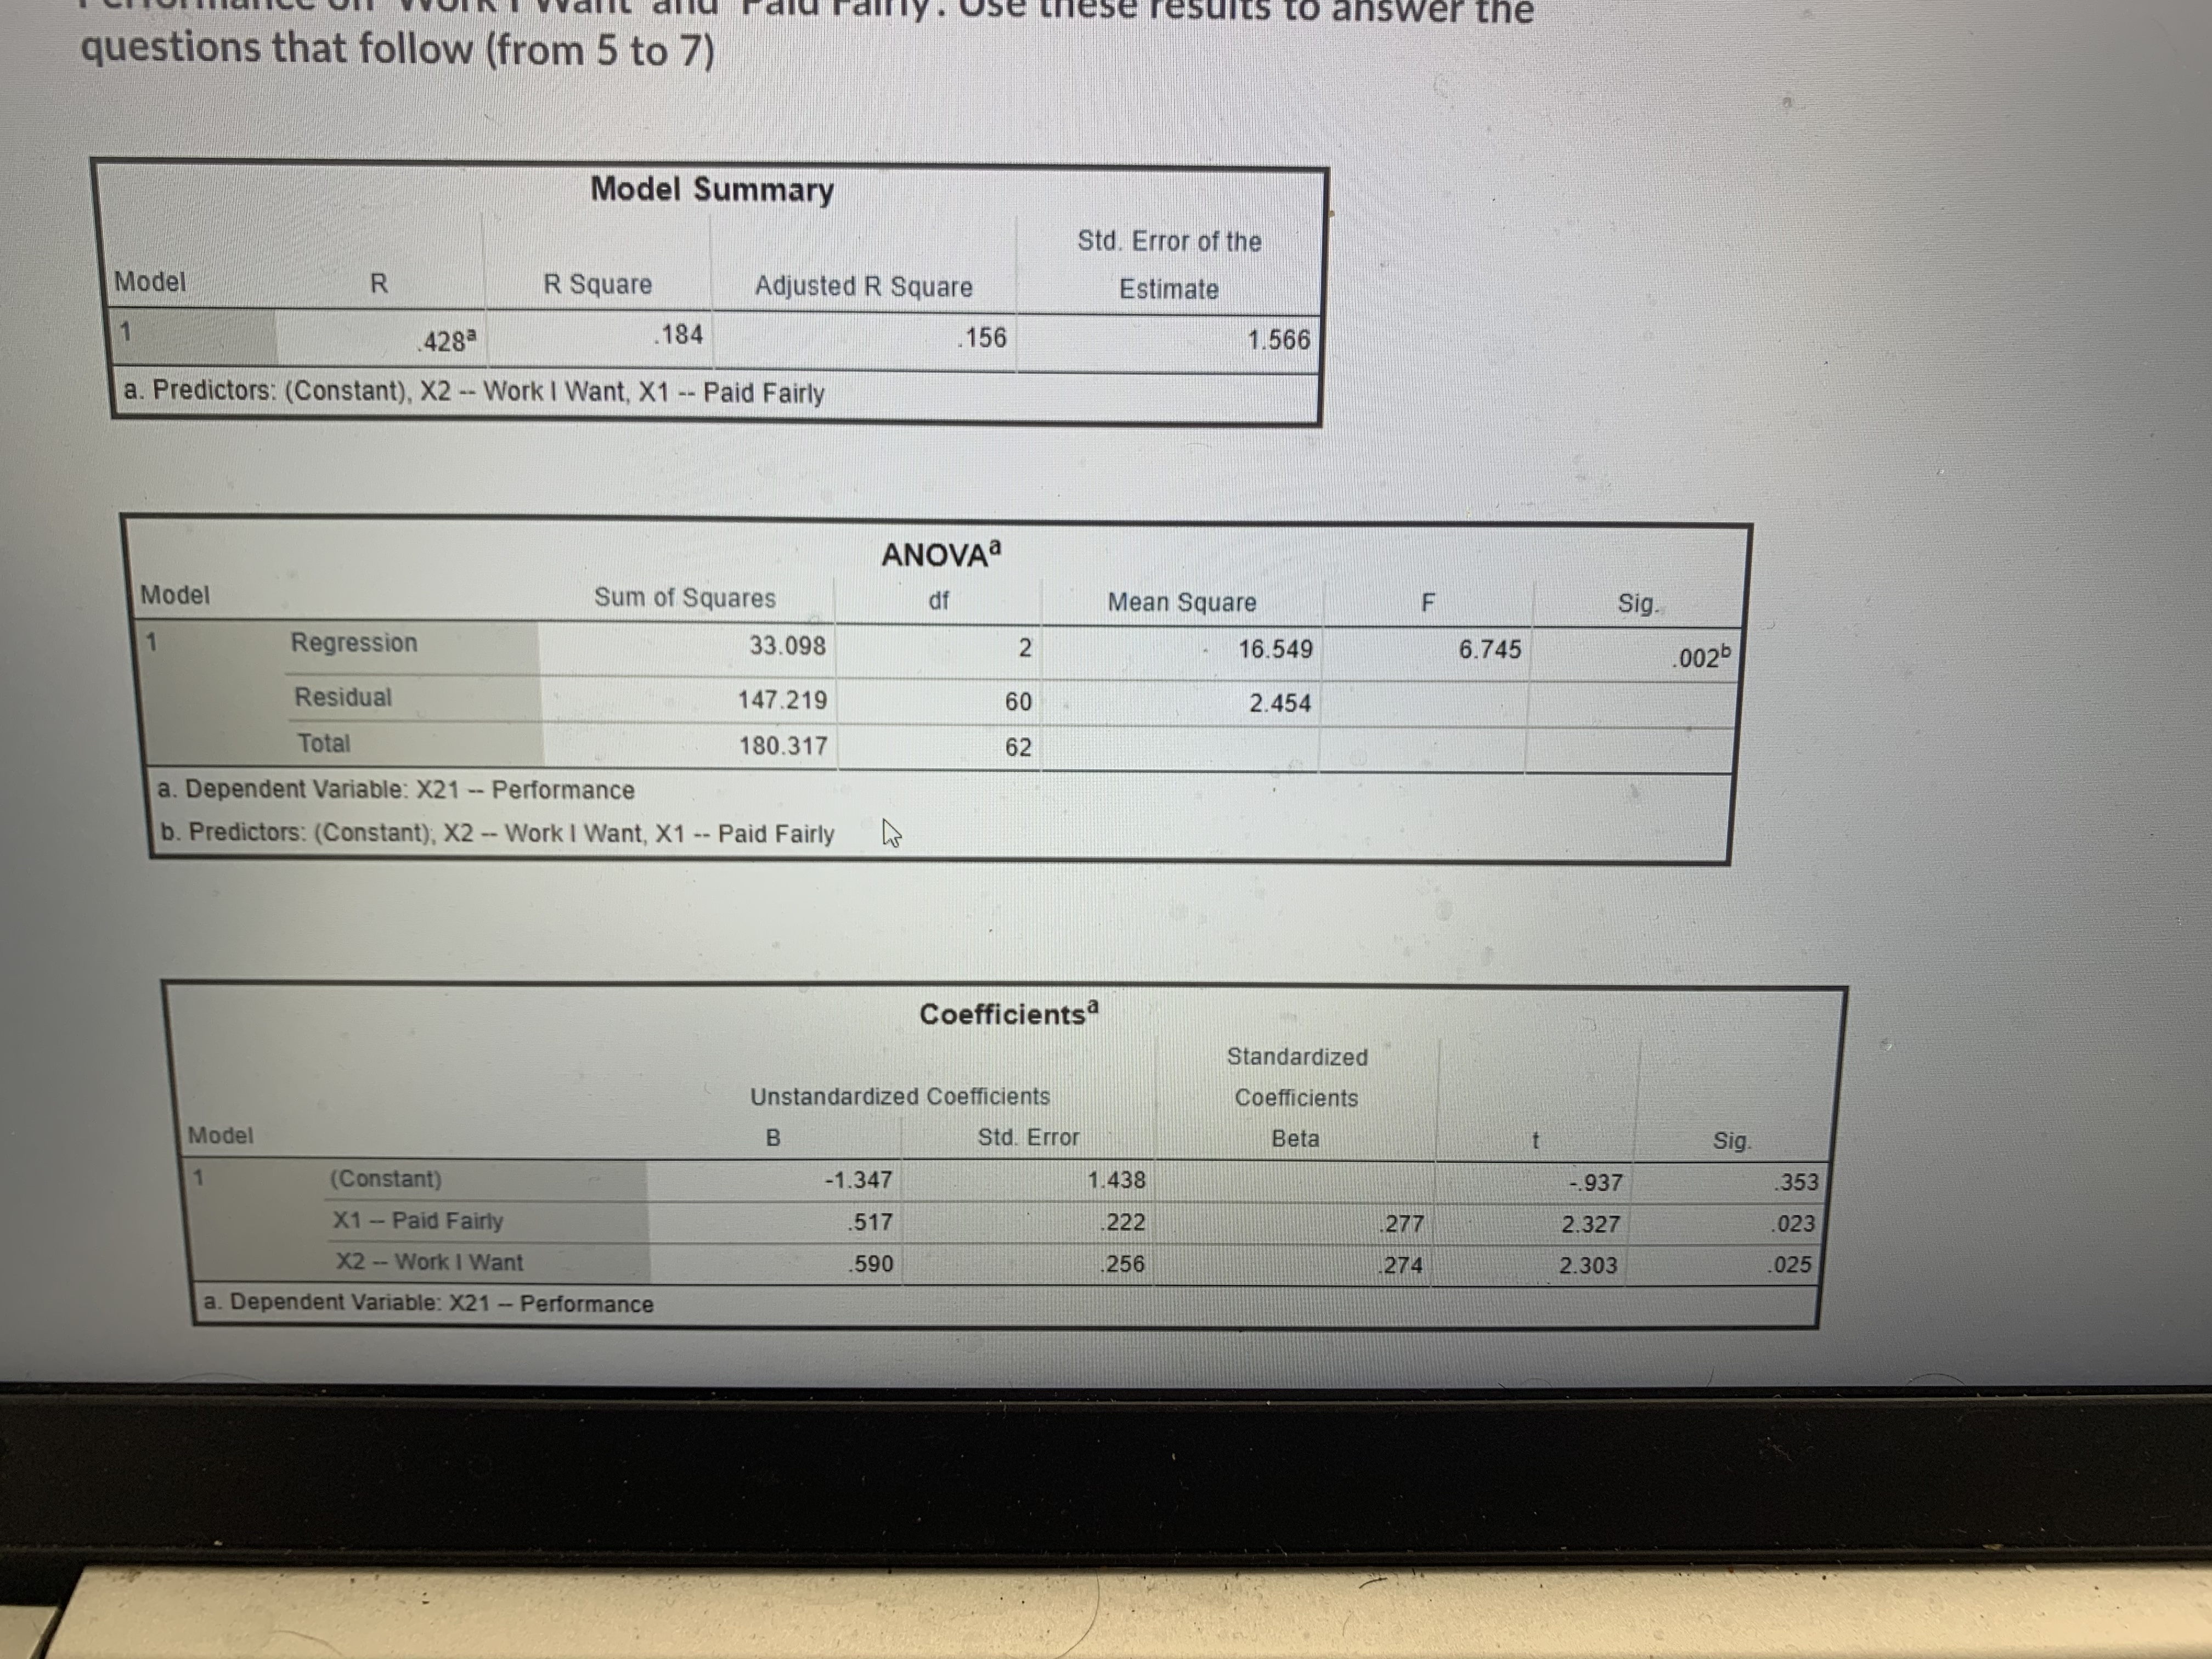

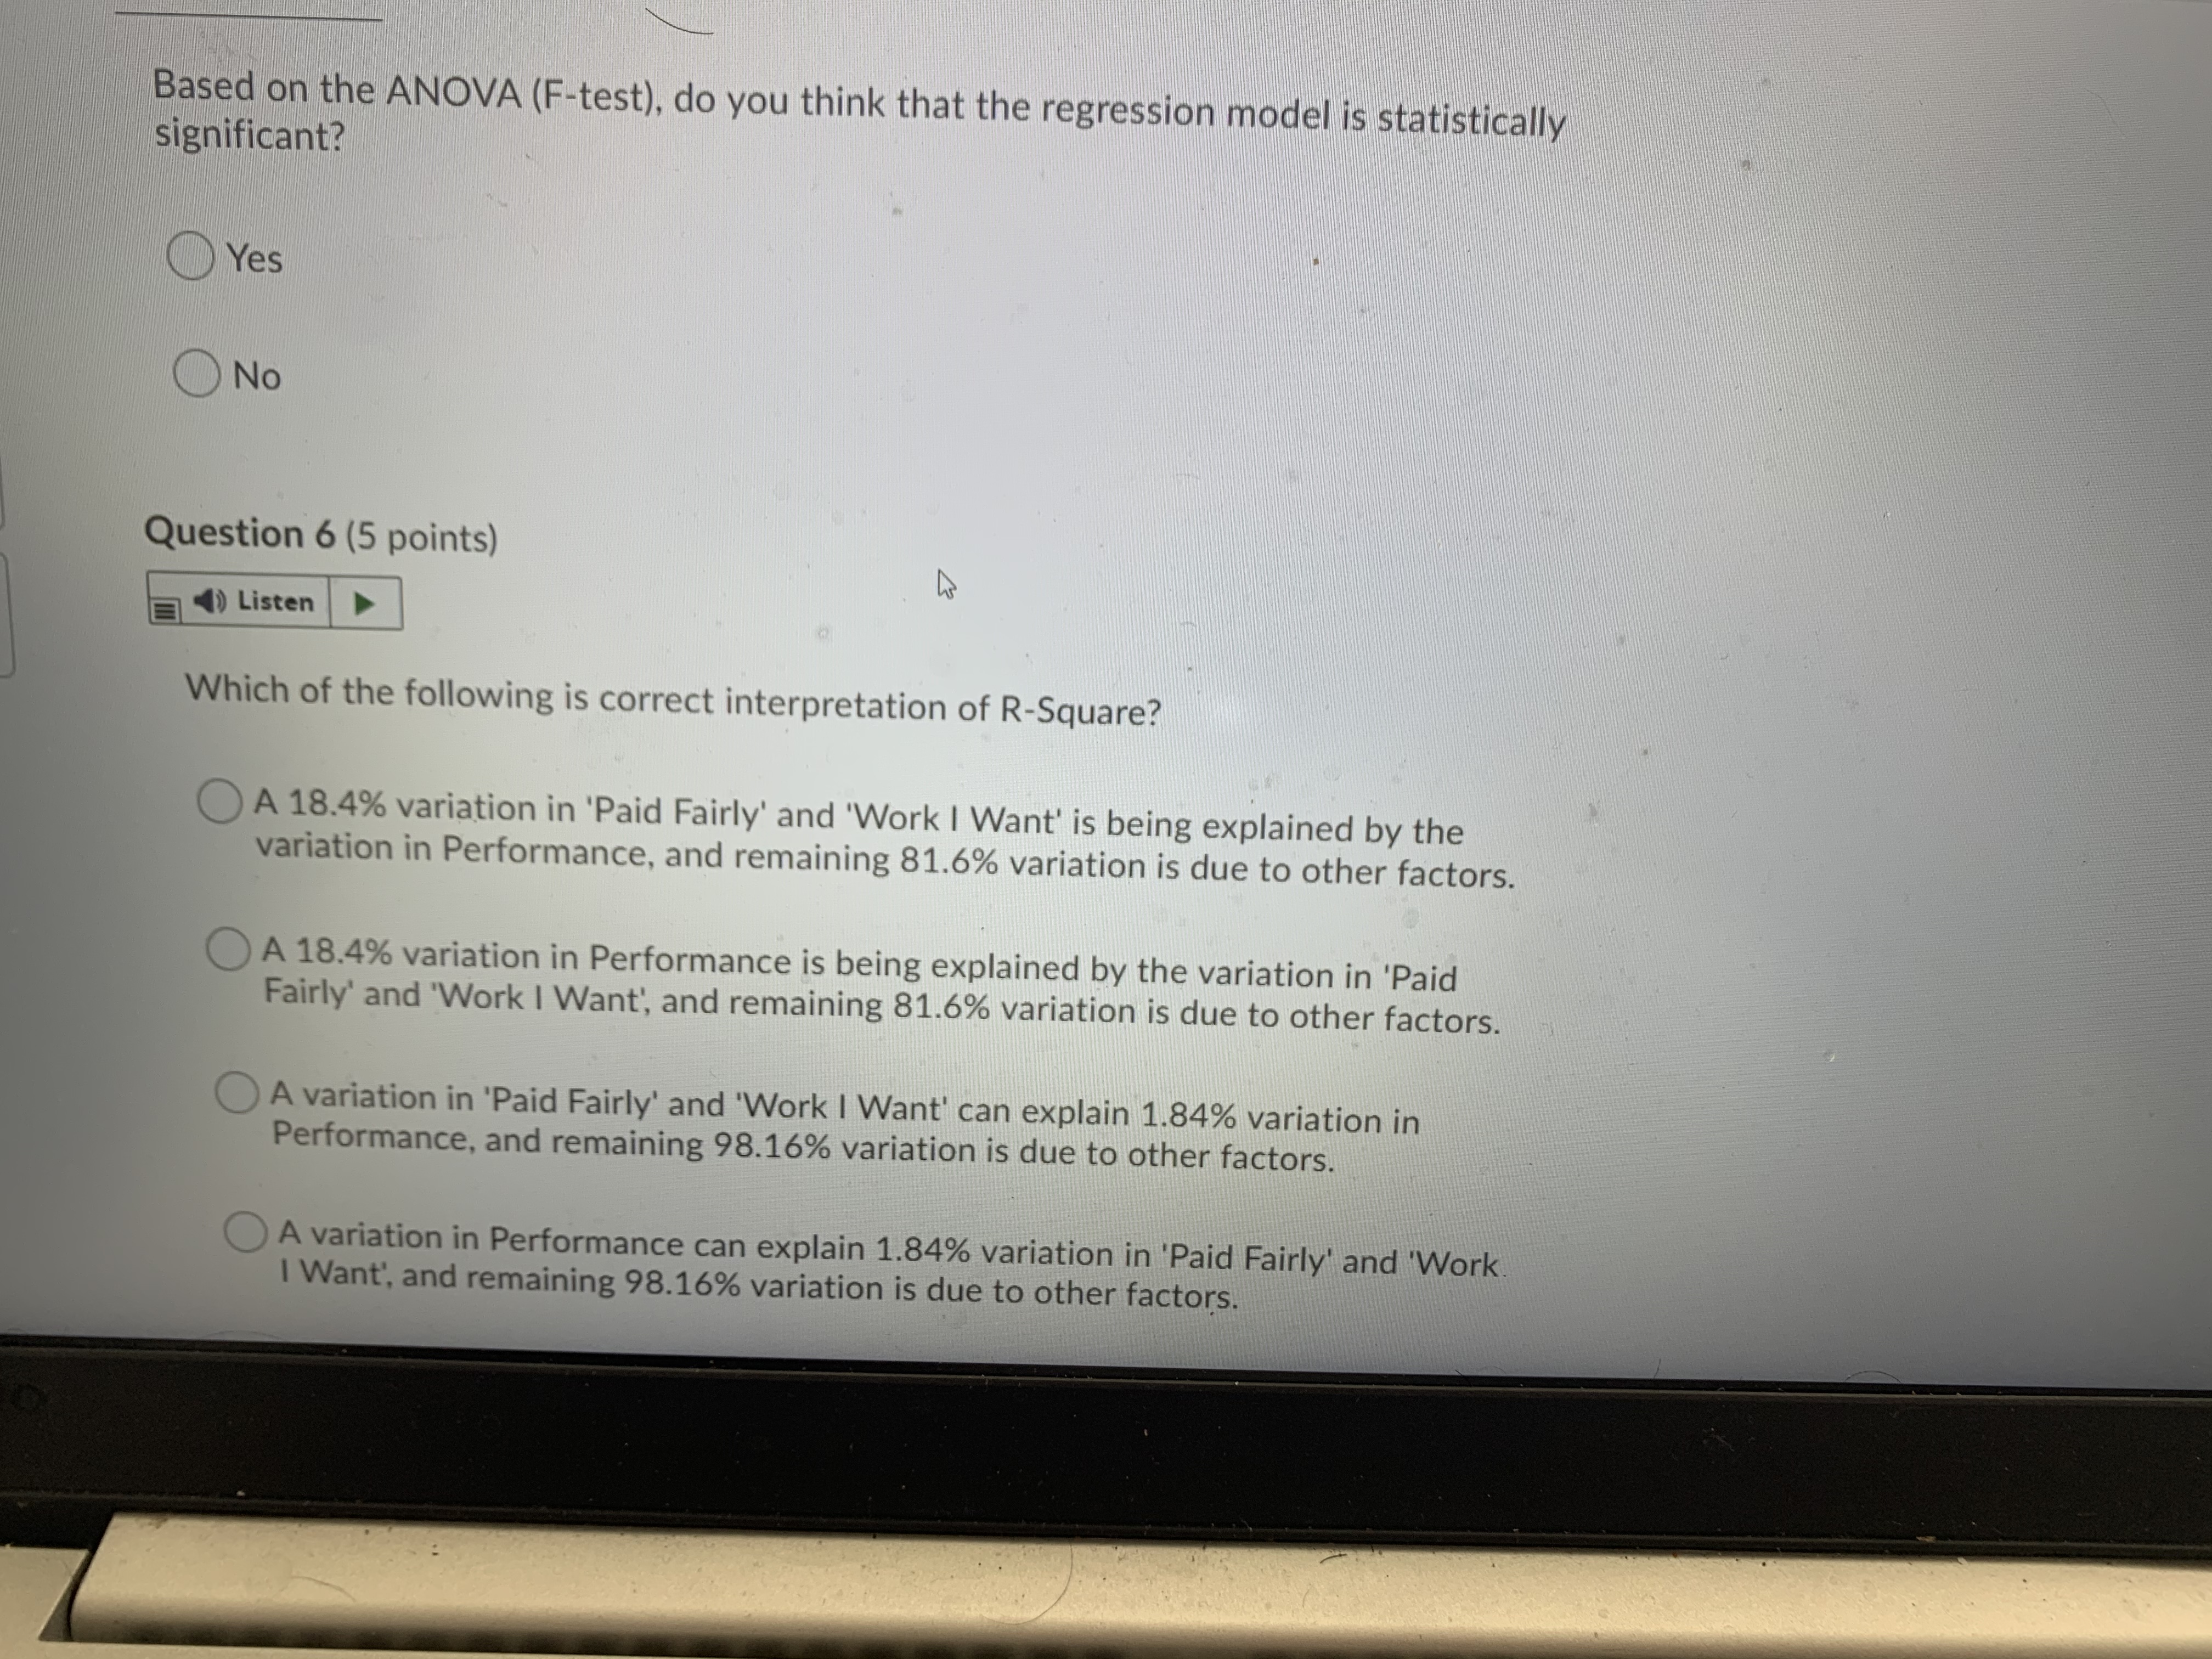
A variation in 'Paid Fairly' and 'Work I Want' can explain 1.84% variation in Performance, and remaining 98.16% variation is due to other factors. A variation in Performance can explain 1.84% variation in 'Paid Fairly' and 'Work I Want', and remaining 98.16% variation is due to other factors. Question 7 (5 points) Listen Interpret regression coefficient (Standardized B) on 'Work I Want. A IV. You are given the following bivariate correlation table. Use this information to answer questions 8 and 9 below.esuits to answer the questions that follow (from 5 to 7) Model Summary Std. Error of the Model R R Square Adjusted R Square Estimate 4283 184 156 1.566 a. Predictors: (Constant), X2 -- Work I Want, X1 -- Paid Fairly ANOVAa Model Sum of Squares df Mean Square F Sig. Regression 33.098 2 16.549 6.745 002b Residual 147.219 60 2.454 Total 180.317 62 a. Dependent Variable: X21 -- Performance b. Predictors: (Constant); X2 -- Work I Want, X1 -- Paid Fairly Coefficientsa Standardized Unstandardized Coefficients Coefficients Model B Std. Error Beta Sig. (Constant) -1.347 1.438 .937 353 X1 - Paid Fairly 517 222 277 2.327 023 X2 - Work I Want 590 256 274 2.303 025 a. Dependent Variable: X21 - PerformanceBased on the ANOVA (F-test), do you think that the regression model is statistically significant? Yes No Question 6 (5 points) ) Listen Which of the following is correct interpretation of R-Square? A 18.4% variation in 'Paid Fairly' and 'Work I Want' is being explained by the variation in Performance, and remaining 81.6% variation is due to other factors. A 18.4% variation in Performance is being explained by the variation in 'Paid Fairly' and 'Work I Want', and remaining 81.6% variation is due to other factors. A variation in 'Paid Fairly' and 'Work I Want' can explain 1.84% variation in Performance, and remaining 98.16% variation is due to other factors. A variation in Performance can explain 1.84% variation in 'Paid Fairly' and 'Work. I Want', and remaining 98.16% variation is due to other factors
Step by Step Solution
There are 3 Steps involved in it

Get step-by-step solutions from verified subject matter experts