

Question: Need highlighted part. example code given: status = read.csv(file = ...) entropy = function(x){ # x is a sequence of frequencies, for example, x =
 Need highlighted part.
example code given:
status = read.csv(file = "...") entropy = function(x){ # x is a sequence of frequencies, for example, x = c(5,9) x.probs = ... x.info = log(x.probs, base = 2) return(x.info) }
# split.Department = aggregate(Count, by = status[c('Department','Status')])
Info = function(count_col, by_col, target_col, data){ # count_col is the column name for the frequency # by_col is the column name defining the group # target_col is the column name defining the target # data is a data.frame # for example, data = play, count_col = "count", by_col = "Outlook", target_col = "PlayTennis" Split = ... n = ... p = ... info = ... return(info) }
Info.gain = function(count_col, by_col, target_col, data){ info.nosplit = Info(count_col, NULL, target_col, data) info.split = Info(count_col, by_col, target_col, data) gain = info.nosplit - info.split return(gain) }
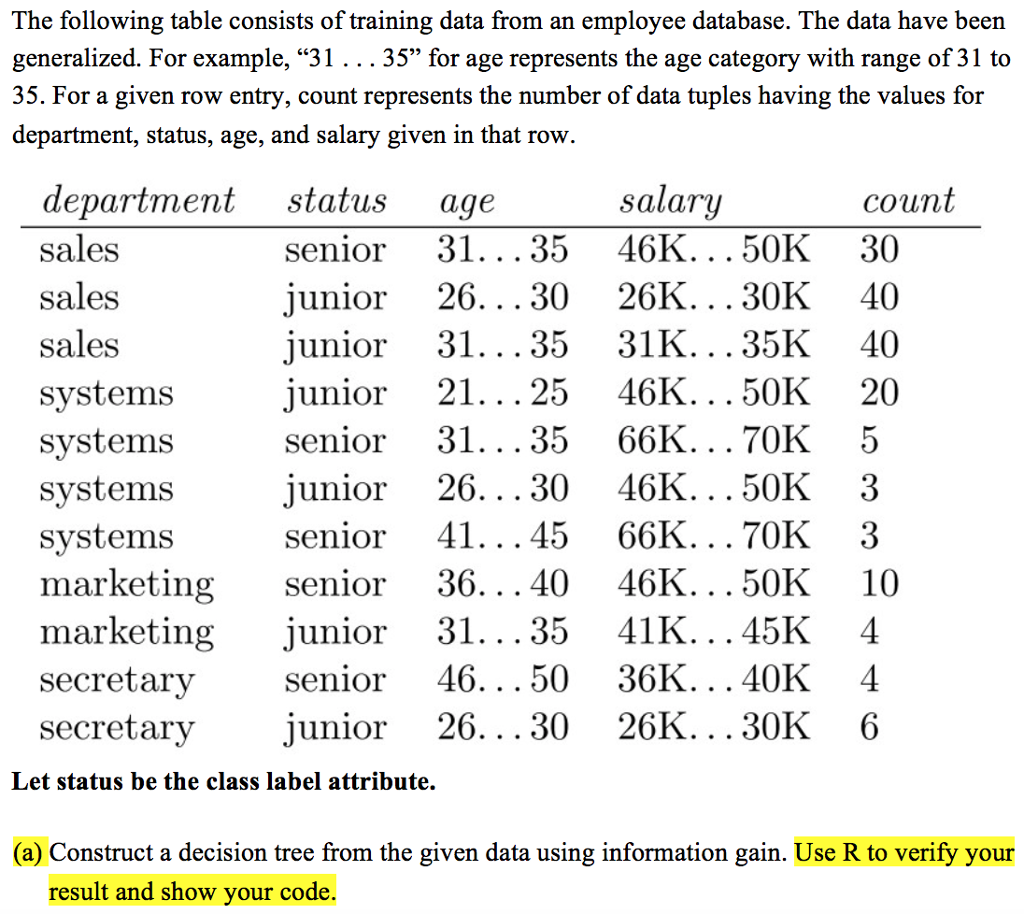
The following table consists of training data from an employee database. The data have been generalized. For example, "31 35" for age represents the age category with range of 31 to 35. For a given row entry, count represents the number of data tuples having the values for department, status, age, and salary given in that row department status age sales sales sales svstems svstems svstems svstems marketing senior salary count senior 31...35 46K. .. 50K 30 junior 26...30 26K...30K 40 Junior 31 35 31K 35K 40 junior 21... 25 46K...50K 20 senior 31.. .35 66K...70K 5 junior 26...30 46K...50K 3 senior 41... 45 66K. .. 70K 3 46K. .. 50K 36. ..40 ting junior 31...35 41K... 45K 4 10 senior 46... 50 36K... 40K 4 junior 26...30 26K... 30K 6 secretarv secretar,y Let status be the class label attribute. (a) Construct a decision tree from the given data using information gain. Use R to verify your result and show your code. The following table consists of training data from an employee database. The data have been generalized. For example, "31 35" for age represents the age category with range of 31 to 35. For a given row entry, count represents the number of data tuples having the values for department, status, age, and salary given in that row department status age sales sales sales svstems svstems svstems svstems marketing senior salary count senior 31...35 46K. .. 50K 30 junior 26...30 26K...30K 40 Junior 31 35 31K 35K 40 junior 21... 25 46K...50K 20 senior 31.. .35 66K...70K 5 junior 26...30 46K...50K 3 senior 41... 45 66K. .. 70K 3 46K. .. 50K 36. ..40 ting junior 31...35 41K... 45K 4 10 senior 46... 50 36K... 40K 4 junior 26...30 26K... 30K 6 secretarv secretar,y Let status be the class label attribute. (a) Construct a decision tree from the given data using information gain. Use R to verify your result and show your code
Step by Step Solution
There are 3 Steps involved in it

Get step-by-step solutions from verified subject matter experts