

Question: Need it as soon as possible. Please An Internet browsing company hired a statistician to determine Internet browsing habits among different provinces in Canada. She
Need it as soon as possible. Please
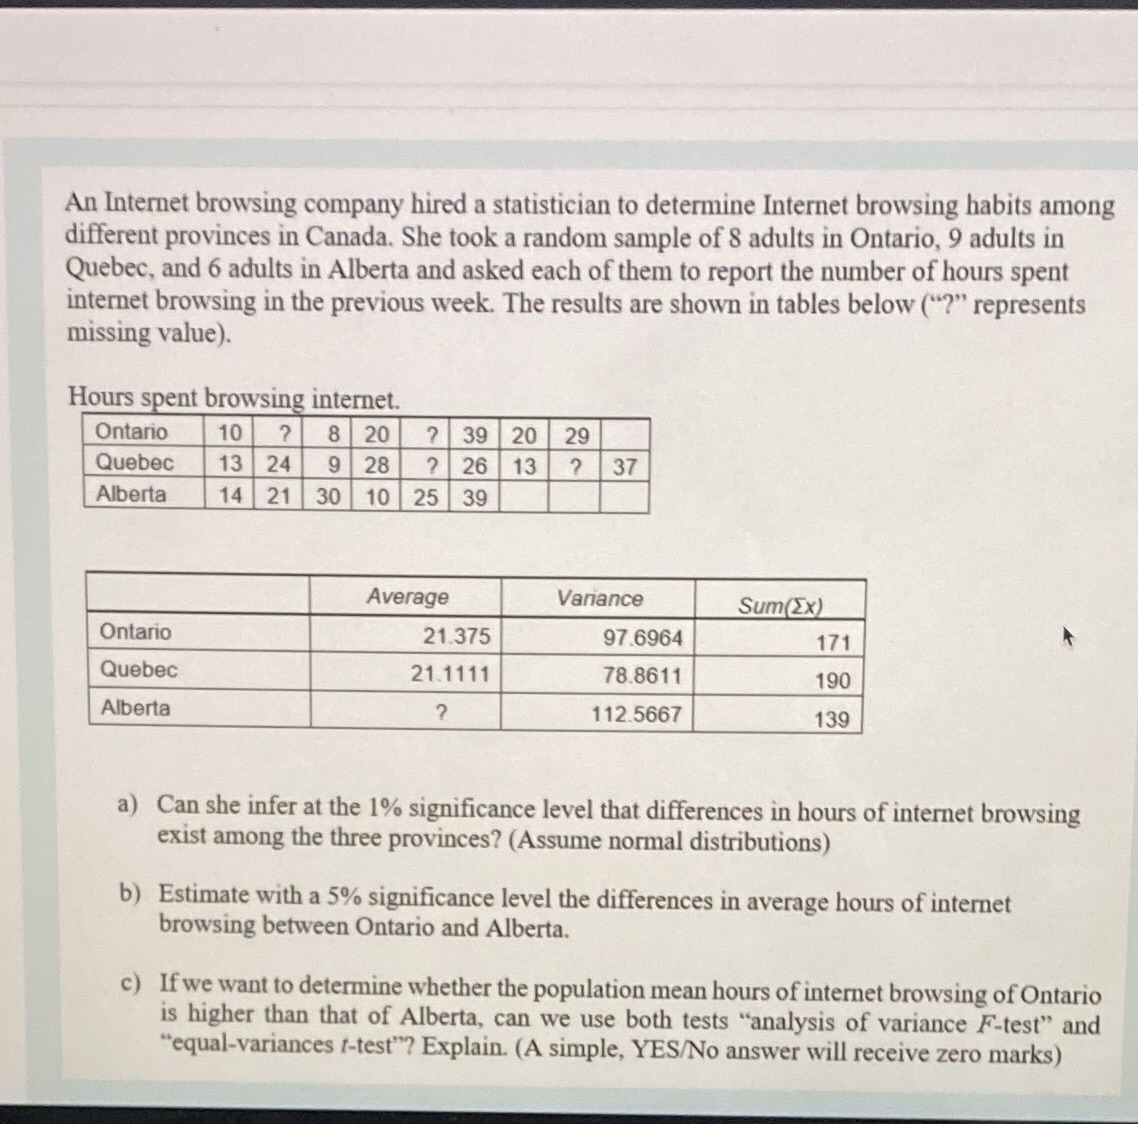
An Internet browsing company hired a statistician to determine Internet browsing habits among different provinces in Canada. She took a random sample of 8 adults in Ontario, 9 adults in Quebec, and 6 adults in Alberta and asked each of them to report the number of hours spent internet browsing in the previous week. The results are shown in tables below ("?" represents missing value). Hours spent browsing internet. Ontario 10 ? 8 20 7 39 20 29 Quebec 13 24 9 28 ? 26 13 2 37 Alberta 14 21 30 10 25 39 Average Variance Sum(XX) Ontario 21.375 97.6964 171 Quebec 21.1111 78.8611 190 Alberta ? 112.5667 139 a) Can she infer at the 1% significance level that differences in hours of internet browsing exist among the three provinces? (Assume normal distributions) b) Estimate with a 5% significance level the differences in average hours of internet browsing between Ontario and Alberta. c) If we want to determine whether the population mean hours of internet browsing of Ontario is higher than that of Alberta, can we use both tests "analysis of variance F-test" and "equal-variances f-test"? Explain. (A simple, YES/No answer will receive zero marks)
Step by Step Solution
There are 3 Steps involved in it

Get step-by-step solutions from verified subject matter experts