

Question: need MATLAB code for each part separately , please do it asap Homework 2 Homework assignment 2 discusses how to use numerical programing to analyze
need MATLAB code for each part separately , please do it asap
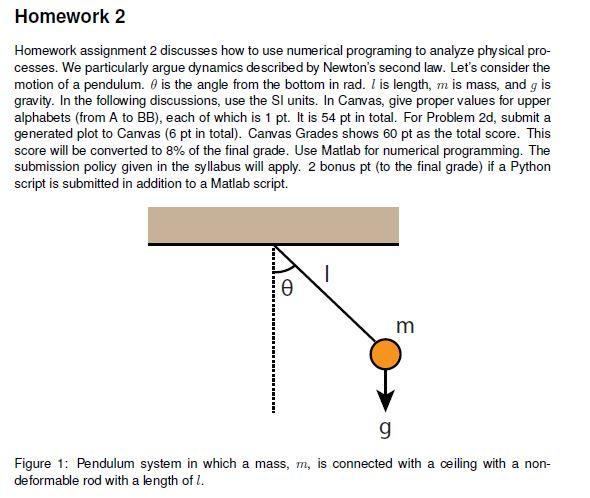
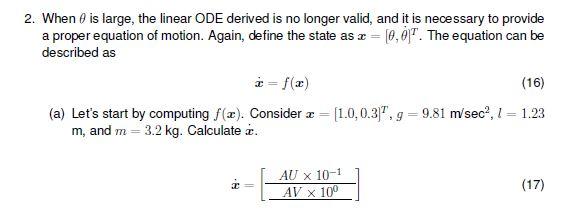
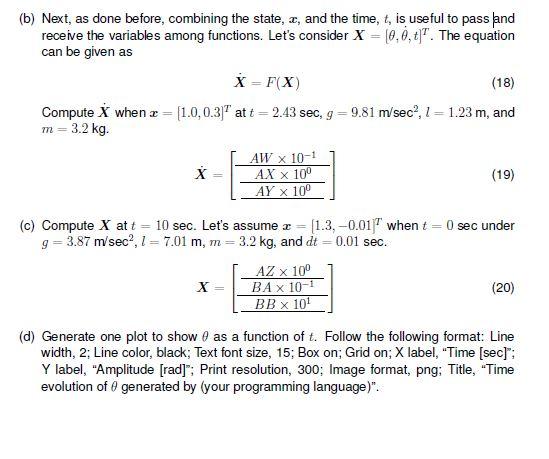
Homework 2 Homework assignment 2 discusses how to use numerical programing to analyze physical pro- cesses. We particularly argue dynamics described by Newton's second law. Let's consider the motion of a pendulum. O is the angle from the bottom in rad. I is length, m is mass, and g is gravity. In the following discussions, use the SI units. In Canvas, give proper values for upper alphabets (from A to BB), each of which is 1 pt. It is 54 pt in total. For Problem 2d, submit a generated plot to Canvas (6 pt in total). Canvas Grades shows 60 pt as the total score. This score will be converted to 8% of the final grade. Use Matlab for numerical programming. The submission policy given in the syllabus will apply. 2 bonus pt (to the final grade) if a Python script is submitted in addition to a Matlab script. m g Figure 1: Pendulum system in which a mass, m, is connected with a ceiling with a non- deformable rod with a length of l. 2. When is large, the linear ODE derived is no longer valid, and it is necessary to provide a proper equation of motion. Again, define the state as r = [0,07. The equation can be described as (16) (a) Let's start by computing f(x). Consider x = (1.0, 0.33, g=9.81 m/sec?, 1= 1.23 m, and m= 3.2 kg. Calculate . AU x 10-1 AV X 100 (17) (b) Next, as done before, combining the state, a, and the time, t, is useful to pass and receive the variables among functions. Let's consider X = (0,0,t]7. The equation can be given as X = F(X) (18) Compute X when x = (1.0,0.3)" at t= 2.43 sec, g = 9.81 m/sec, 1-1.23 m, and m=3.2 kg. AW x 10-1 X AX x 10 (19) AY X 10 0 sec under (c) Compute X at t = 10 sec. Let's assume r = (1.3,-0.01" when 9=3.87 m/sec2,1 = 7.01 m, m=3.2 kg, and dt = 0.01 sec. AZ x 10 X= BAX 10-1 BB x 10 (20) (d) Generate one plot to show e as a function of t. Follow the following format: Line width, 2; Line color, black; Text font size, 15; Box on; Grid on; X label, "Time (sec); Y label, "Amplitude (rad)"; Print resolution, 300; Image format, png; Title, "Time evolution of generated by your programming language)". Homework 2 Homework assignment 2 discusses how to use numerical programing to analyze physical pro- cesses. We particularly argue dynamics described by Newton's second law. Let's consider the motion of a pendulum. O is the angle from the bottom in rad. I is length, m is mass, and g is gravity. In the following discussions, use the SI units. In Canvas, give proper values for upper alphabets (from A to BB), each of which is 1 pt. It is 54 pt in total. For Problem 2d, submit a generated plot to Canvas (6 pt in total). Canvas Grades shows 60 pt as the total score. This score will be converted to 8% of the final grade. Use Matlab for numerical programming. The submission policy given in the syllabus will apply. 2 bonus pt (to the final grade) if a Python script is submitted in addition to a Matlab script. m g Figure 1: Pendulum system in which a mass, m, is connected with a ceiling with a non- deformable rod with a length of l. 2. When is large, the linear ODE derived is no longer valid, and it is necessary to provide a proper equation of motion. Again, define the state as r = [0,07. The equation can be described as (16) (a) Let's start by computing f(x). Consider x = (1.0, 0.33, g=9.81 m/sec?, 1= 1.23 m, and m= 3.2 kg. Calculate . AU x 10-1 AV X 100 (17) (b) Next, as done before, combining the state, a, and the time, t, is useful to pass and receive the variables among functions. Let's consider X = (0,0,t]7. The equation can be given as X = F(X) (18) Compute X when x = (1.0,0.3)" at t= 2.43 sec, g = 9.81 m/sec, 1-1.23 m, and m=3.2 kg. AW x 10-1 X AX x 10 (19) AY X 10 0 sec under (c) Compute X at t = 10 sec. Let's assume r = (1.3,-0.01" when 9=3.87 m/sec2,1 = 7.01 m, m=3.2 kg, and dt = 0.01 sec. AZ x 10 X= BAX 10-1 BB x 10 (20) (d) Generate one plot to show e as a function of t. Follow the following format: Line width, 2; Line color, black; Text font size, 15; Box on; Grid on; X label, "Time (sec); Y label, "Amplitude (rad)"; Print resolution, 300; Image format, png; Title, "Time evolution of generated by your programming language)
Step by Step Solution
There are 3 Steps involved in it

Get step-by-step solutions from verified subject matter experts