

Question: need on excel clearly 6 On the Forecast sheet, start in cell E3. Complete the series of substitution values ranging from 10 to 200 at
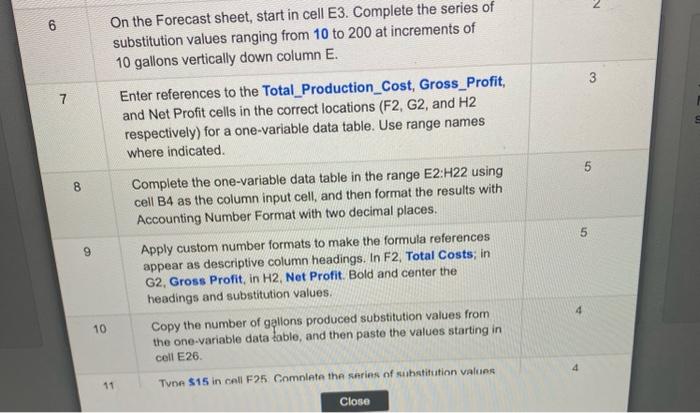
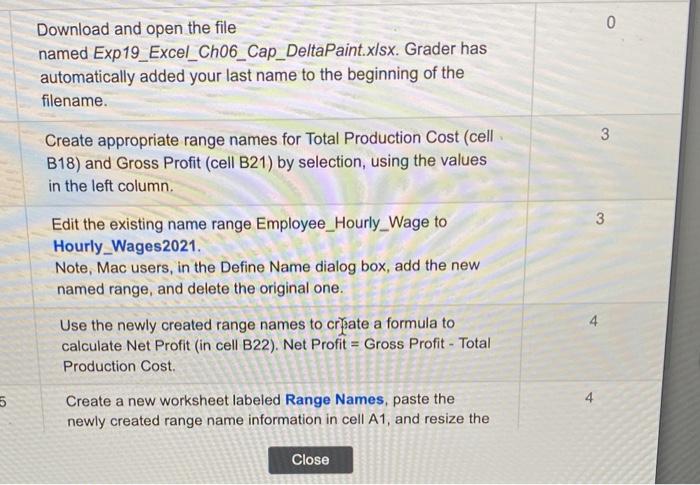
6 On the Forecast sheet, start in cell E3. Complete the series of substitution values ranging from 10 to 200 at increments of 10 gallons vertically down column E. 7 Enter references to the Total_Production_Cost, Gross_Profit, and Net Profit cells in the correct locations (F2, G2, and H2 respectively) for a one-variable data table. Use range names where indicated. 8 Complete the one-variable data table in the range E2:H22 using cell B4 as the column input cell, and then format the results with Accounting Number Format with two decimal places. Apply custom number formats to make the formula references appear as descriptive column headings. In F2, Total Costs; in G2, Gross Profit, in H2, Net Profit. Bold and center the headings and substitution values. 10 Copy the number of gallons produced substitution values from the one-variable data table, and then paste the values starting in cell E26. 11. Tune $15 in cell F25 Comnlete the saries of substitution values Close Download and open the file 0 named Exp19_Excel_Ch06_Cap_DeltaPaint.xlsx. Grader has automatically added your last name to the beginning of the filename. Create appropriate range names for Total Production Cost (cell 3 B18) and Gross Profit (cell B21) by selection, using the values in the left column. Edit the existing name range Employee_Hourly_Wage to 3 Hourly_Wages2021. Note, Mac users, in the Define Name dialog box, add the new named range, and delete the original one. Use the newly created range names to crate a formula to calculate Net Profit (in cell B22). Net Profit = Gross Profit - Total Production Cost. Create a new worksheet labeled Range Names, paste the newly created range name information in cell A1, and resize the Close 6 On the Forecast sheet, start in cell E3. Complete the series of substitution values ranging from 10 to 200 at increments of 10 gallons vertically down column E. 7 Enter references to the Total_Production_Cost, Gross_Profit, and Net Profit cells in the correct locations (F2, G2, and H2 respectively) for a one-variable data table. Use range names where indicated. 8 Complete the one-variable data table in the range E2:H22 using cell B4 as the column input cell, and then format the results with Accounting Number Format with two decimal places. Apply custom number formats to make the formula references appear as descriptive column headings. In F2, Total Costs; in G2, Gross Profit, in H2, Net Profit. Bold and center the headings and substitution values. 10 Copy the number of gallons produced substitution values from the one-variable data table, and then paste the values starting in cell E26. 11. Tune $15 in cell F25 Comnlete the saries of substitution values Close Download and open the file 0 named Exp19_Excel_Ch06_Cap_DeltaPaint.xlsx. Grader has automatically added your last name to the beginning of the filename. Create appropriate range names for Total Production Cost (cell 3 B18) and Gross Profit (cell B21) by selection, using the values in the left column. Edit the existing name range Employee_Hourly_Wage to 3 Hourly_Wages2021. Note, Mac users, in the Define Name dialog box, add the new named range, and delete the original one. Use the newly created range names to crate a formula to calculate Net Profit (in cell B22). Net Profit = Gross Profit - Total Production Cost. Create a new worksheet labeled Range Names, paste the newly created range name information in cell A1, and resize the Close
Step by Step Solution
There are 3 Steps involved in it

Get step-by-step solutions from verified subject matter experts