

Question: ** need proper Discussion (company performance) part based on above the following data (it's a bank performance data) Subject: Engineering Management INCOME STATEMENT Breakdown TTM
** need proper Discussion (company performance) part based on above the following data (it's a bank performance data)
Subject: Engineering Management
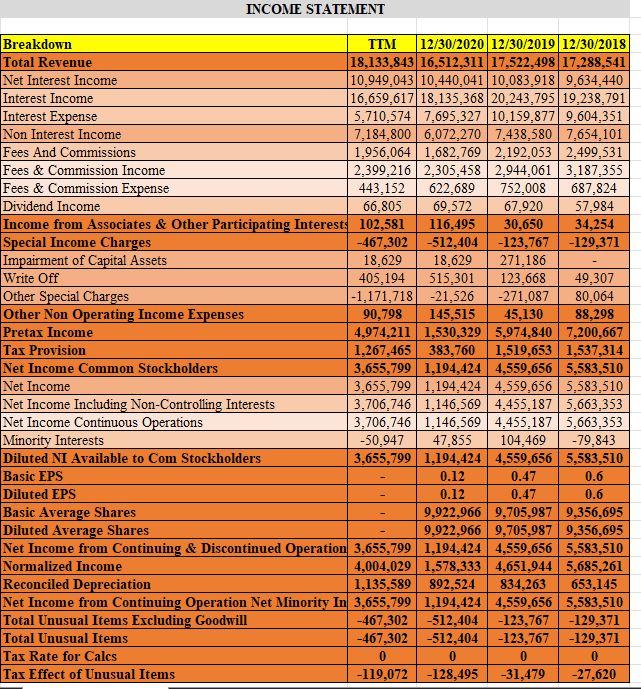
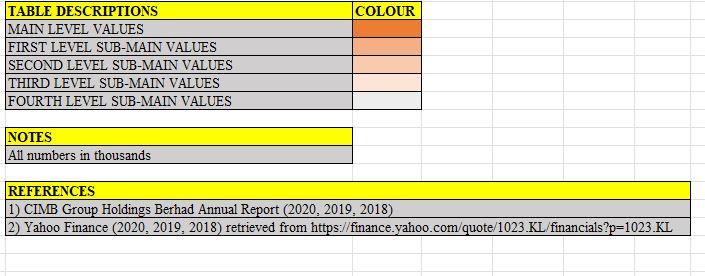
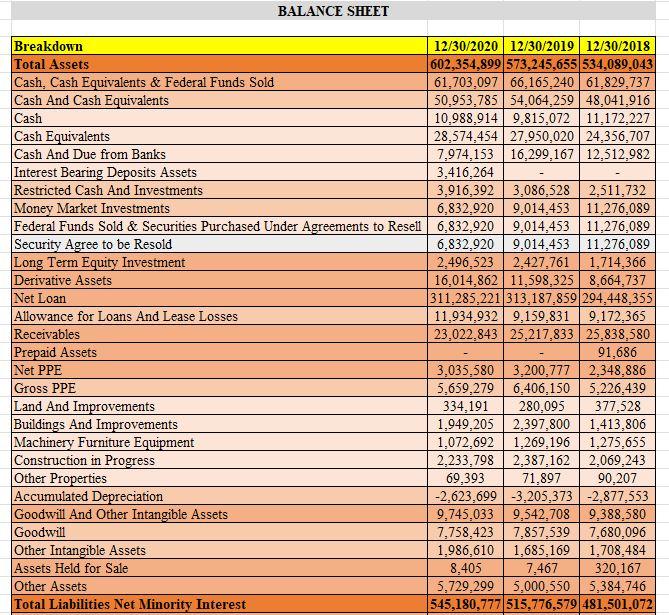
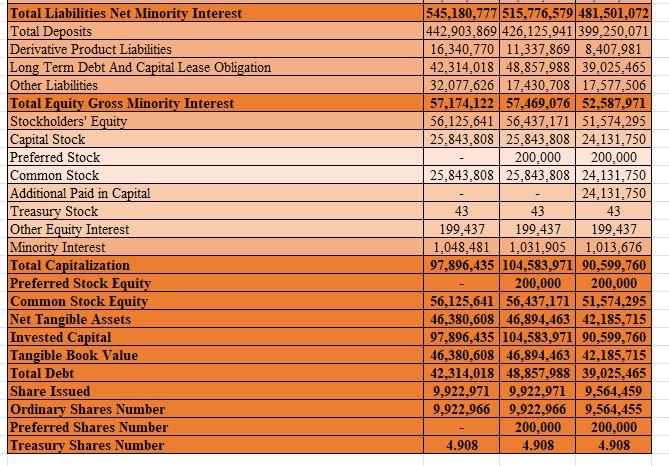
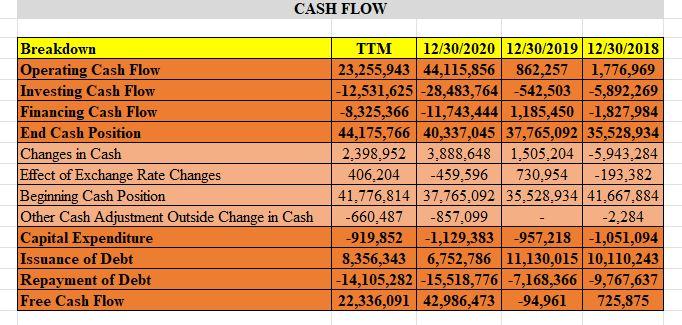
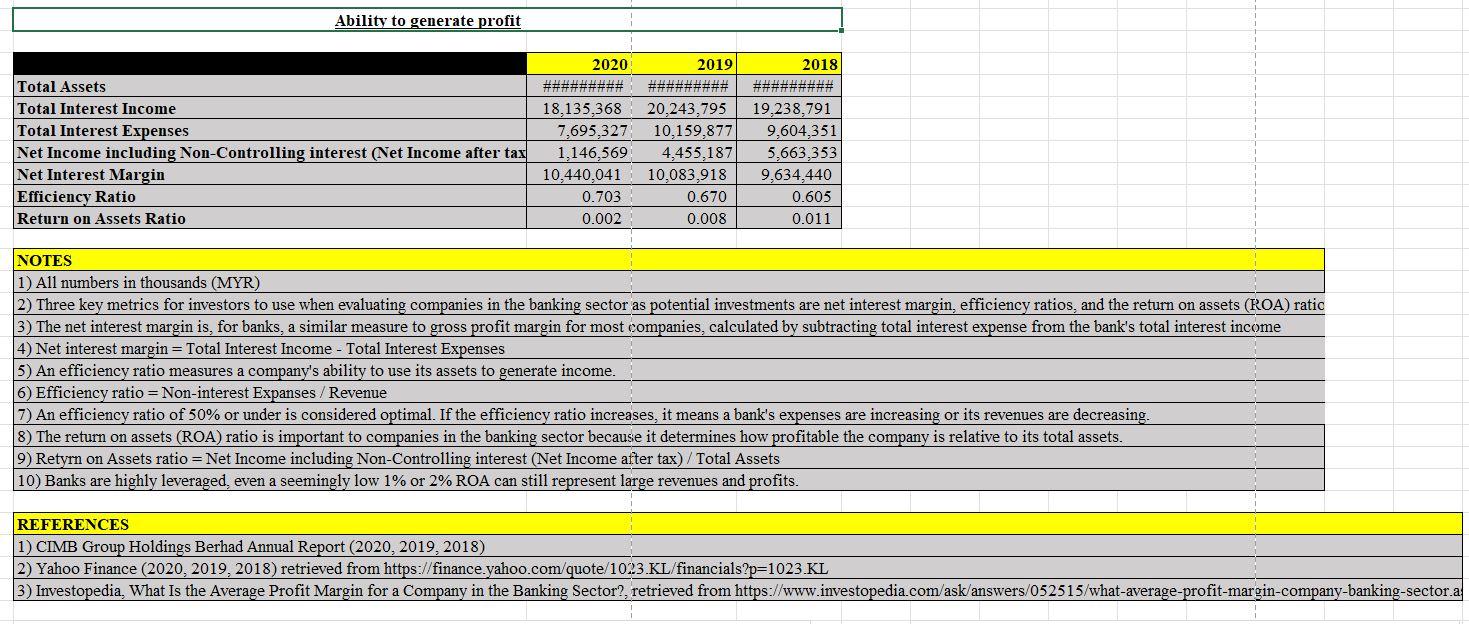
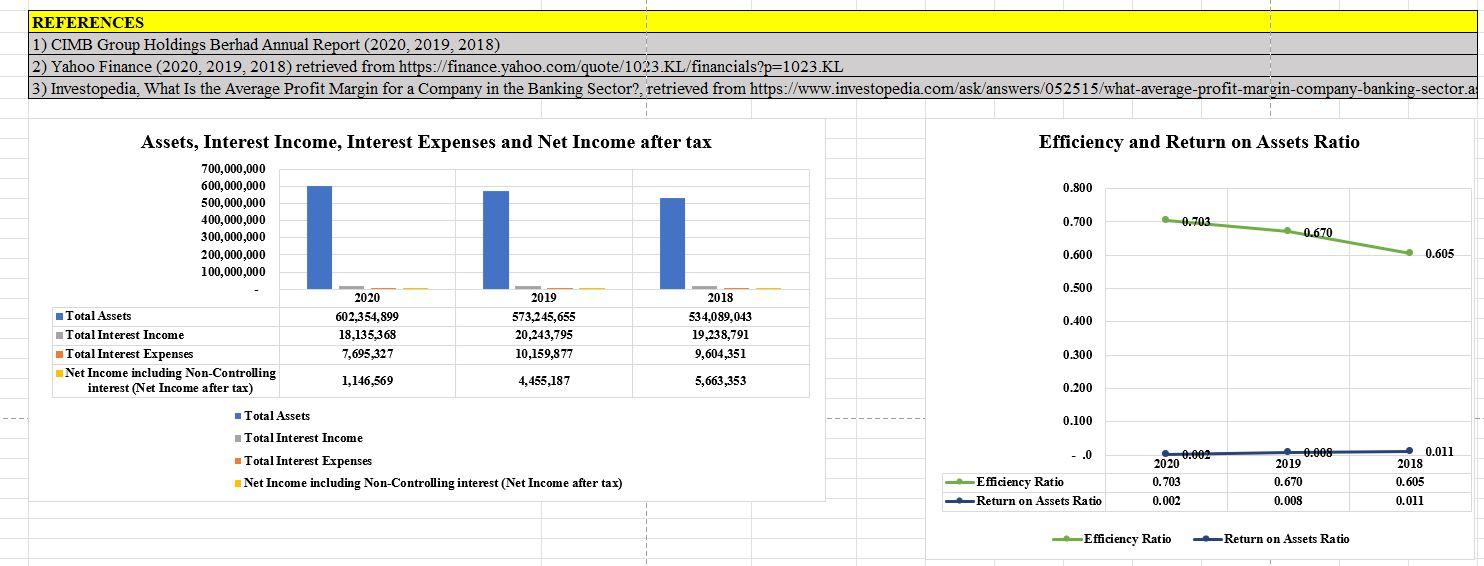
INCOME STATEMENT Breakdown TTM 12/30/2020 12/30/2019 12/30/2018 Total Revenue 18,133,843 16,512,31117,522,498 17,288,541 Net Interest Income 10,949,043 10.440,041 10,083.918 9,634,440 Interest Income 16,659,617 18,135,368 20,243,795 19,238,791 Interest Expense 5,710,574 7,695,327 10.159,877 9,604,351 Non Interest Income 7.184.800 6,072,270 7,438,580 7.654,101 Fees And Commissions 1,956,064 1,682,769 2,192,053 2.499,531 Fees & Commission Income 2,399,216 2,305,458 2.944,061 3,187,355 Fees & Commission Expense 443,152 622,689 752,008 687,824 Dividend Income 66,805 69,572 67.920 57,984 Income from Associates & Other Participating Interest: 102,581 116,495 30,650 34,254 Special Income Charges -467,302 -512,404 -123,767 -129,371 Impairment of Capital Assets 18,629 18,629 271,186 Write Off 405,194 515,301 123,668 49,307 Other Special Charges -1,171,718 -21,526 -271,087 80,064 Other Non Operating Income Expenses 90,798 145,515 45,130 88,298 Pretax Income 4,974,211 1,530,329 5,974,840 7,200.667 Tax Provision 1,267,465 383,760 1,519,653 1,537,314 Net Income Common Stockholders 3,655,799 1,194,424 4,559,656 5,583,510 Net Income 3,655,799 1,194,424 4,559,656 5,583,510 Net Income Including Non-Controlling Interests 3,706,746 1,146,569 4,455,187 5,663,353 Net Income Continuous Operations 3,706,746 1.146,569 4,455.187 5,663,353 Minority Interests -50.947 47.855 104,469 -79,843 Diluted NI Available to Com Stockholders 3,655,799 1,194,424 4,559,656 5,583,510 Basic EPS 0.12 0.47 0.6 Diluted EPS 0.12 0.47 0.6 Basic Average Shares 9,922,966 9,705,987 9,356,695 Diluted Average Shares 9,922,966 9,705,987 9,356,695 Net Income from Continuing & Discontinued Operation 3,655,799 1,194,424 4,559,656 5,583,510 Normalized Income 4,004,029 1,578,333 4,651,944 5,685,261 Reconciled Depreciation 1,135,589 892,524 834,263 653,145 Net Income from Continuing Operation Net Minority In 3,655,799 1,194,424 4,559,656 5,583,510 Total Unusual Items Excluding Goodwill -467,302 -512,404 -123,767 -129,371 Total Unusual Items - 467,302 -512,404 -123,767 -129,371 Tax Rate for Calcs 0 0 0 0 Tax Effect of Unusual Items -119,072 -128,495 -31,479 -27,620 COLOUR TABLE DESCRIPTIONS MAIN LEVEL VALUES FIRST LEVEL SUB-MAIN VALUES SECOND LEVEL SUB-MAIN VALUES THIRD LEVEL SUB-MAIN VALUES FOURTH LEVEL SUB-MAIN VALUES NOTES All numbers in thousands REFERENCES 1) CIMB Group Holdings Berhad Annual Report (2020, 2019, 2018) 2) Yahoo Finance (2020, 2019, 2018) retrieved from https://finance.yahoo.com/quote/1023.KL/financials?p=1023.KL BALANCE SHEET Breakdown 12/30/2020 12/30/2019 12/30/2018 Total Assets 602,354,899 573,245,655 534,089,043 Cash, Cash Equivalents & Federal Funds Sold 61,703,097 66,165.240 61,829.737 Cash And Cash Equivalents 50,953,785 54,064,259 48,041,916 Cash 10,988,914 9.815,072 11,172,227 Cash Equivalents 28,574,454 27,950.020 24,356,707 Cash And Due from Banks 7,974,153 16,299,167 12.512,982 Interest Bearing Deposits Assets 3,416,264 Restricted Cash And Investments 3,916,392 3,086,528 2.511,732 Money Market Investments 6,832,920 9,014,453 11,276,089 Federal Funds Sold & Securities Purchased Under Agreements to Resett 6,832,920 9,014,453 11,276,089 Security Agree to be Resold 6,832,920 9,014,453 11,276,089 Long Term Equity Investment 2,496,5232,427,761 1,714,366 Derivative Assets 16,014,862 11,598,325 8,664,737 Net Loan 311,285,221 313,187,859 294,448,355 Allowance for Loans And Lease Losses 11,934,932 9,159,831 9,172,365 Receivables 23,022.84325,217,83325,838,580 Prepaid Assets 91,686 Net PPE 3,035,580 3,200,777 2,348.886 Gross PPE 5.659,279 6,406,150 5,226,439 Land And Improvements 334,191 280,095 377,528 Buildings And Improvements 1,949,205 2,397,800 1,413,806 Machinery Furniture Equipment 1,072,692 1,269,196 1,275,655 Construction in Progress 2,233,798 2.387.162 2,069,243 Other Properties 69,393 71,897 90.207 Accumulated Depreciation -2,623,699 -3,205,373 -2,877,553 Goodwill And Other Intangible Assets 9,745,033 9,542,708 9,388,580 Goodwill 7,758,423 7,857,5397,680,096 Other Intangible Assets 1,986,6101,685,169 1,708,484 Assets Held for Sale 8,405 7,467 320,167 Other Assets 5,729,2995,000,550 5,384,746 Total Liabilities Net Minority Interest 545,180.777 515,776,579 481,501,072 Total Liabilities Net Minority Interest Total Deposits Derivative Product Liabilities Long Term Debt And Capital Lease Obligation Other Liabilities Total Equity Gross Minority Interest Stockholders' Equity Capital Stock Preferred Stock Common Stock Additional Paid in Capital Treasury Stock Other Equity Interest Minority Interest Total Capitalization Preferred Stock Equity Common Stock Equity Net Tangible Assets Invested Capital Tangible Book Value Total Debt Share Issued Ordinary Shares Number Preferred Shares Number Treasury Shares Number 545,180,777 515,776,579 481,501,072 442,903.869 426,125,941 399,250,071 16,340,770 11,337,869 8,407,981 42,314,018 48,857,988 39,025,465 32,077.626 17,430,708 17,577,506 57,174,122 57,469,076 52,587,971 56,125,641 56,437,171 51,574,295 25.843,808 25.843,808 24.131.750 200,000 200,000 25,843,808 25,843,808 24,131,750 24,131,750 43 43 43 199,437 199,437 199,437 1,048,481 1,031,905 1,013,676 97,896,435 104,583,971 90,599,760 200,000 200,000 56,125,641 56.437,171 51,574.295 46,380,608 46,894,463 42.185,715 97,896,435 104,583,971 90,599.760 46,380,608 46,894,463 42,185,715 42,314,018 48,857,988 39,025,465 9,922.971 9.922,971 9,564,459 9,922,966 9.922,966 9,564,455 200,000 200,000 4.908 4.908 4.908 CASH FLOW Breakdown Operating Cash Flow Investing Cash Flow Financing Cash Flow End Cash Position Changes in Cash Effect of Exchange Rate Changes Beginning Cash Position Other Cash Adjustment Outside Change in Cash Capital Expenditure Issuance of Debt Repayment of Debt Free Cash Flow TTM 12/30/2020 12/30/2019 12/30/2018 23,255,943 44,115,856 862,257 1,776,969 - 12,531,625 -28,483,764 -542,503 5,892,269 -8,325,366 -11,743,444 1,185,450 -1,827,984 44,175,766 40,337,045 37,765,092 35,528,934 2,398,952 3.888.648 | 1,505,204 -5,943,284 406,204 -459,596 730.954 -193,382 41.776.814 37.765,092 35,528.934 41,667.884 -660,487 -857,099 -2.284 -919,852 -1,129,383 -957,218 -1,051,094 8,356,343 6,752,786 11,130,015 10,110,243 -14,105,282 -15,518,776 -7,168,366 -9,767,637 22,336,091 42,986,473 -94,961 725,875 Ability to generate profit 2019 Total Assets Total Interest Income Total Interest Expenses Net Income including Non-Controlling interest (Net Income after tax Net Interest Margin Efficiency Ratio Return on Assets Ratio 2020 ######### 18,135,368 7,695,327 1,146,569 10.440,041 0.703 0.002 20,243,795 10,159,877 4,455,187 10,083,918 0.670 0.008 2018 ######### 19,238,791 9,604,351 5,663,353 9,634,440 0.605 0.011 NOTES (1) All numbers in thousands (MYR) 2) Three key metrics for investors to use when evaluating companies in the banking sector as potential investments are net interest margin, efficiency ratios, and the return on assets (ROA) ratic 3) The net interest margin is, for banks, a similar measure to gross profit margin for most companies, calculated by subtracting total interest expense from the bank's total interest income 4) Net interest margin = Total Interest Income - Total Interest Expenses 5) An efficiency ratio measures a company's ability to use its assets to generate income. 6) Efficiency ratio = Non-interest Expanses / Revenue 7) An efficiency ratio of 50% or under is considered optimal. If the efficiency ratio increases, it means a bank's expenses are increasing or its revenues are decreasing. 8) The return on assets (ROA) ratio is important to companies in the banking sector because it determines how profitable the company is relative to its total assets. 9) Retyrn on Assets ratio = Net Income including Non-Controlling interest (Net Income after tax)/Total Assets 10) Banks are highly leveraged even a seemingly low 1% or 2% ROA can still represent large revenues and profits. REFERENCES 1) CIMB Group Holdings Berhad Annual Report (2020, 2019, 2018) 2) Yahoo Finance (2020, 2019, 2018) retrieved from https://finance.yahoo.com/quote/1023.KL/financials?p=1023.KL 3) Investopedia, What Is the Average Profit Margin for a Company in the Banking Sector?, retrieved from https://www.investopedia.com/ask/answers/052515/what-average-profit-margin-company-banking-sector.a REFERENCES 1) CIMB Group Holdings Berhad Annual Report (2020, 2019, 2018) 2) Yahoo Finance (2020, 2019, 2018) retrieved from https://finance.yahoo.com/quote/1023.KL/financials?p=1023.KL 3) Investopedia, What Is the Average Profit Margin for a Company in the Banking Sector?, retrieved from https://www.investopedia.com/ask/answers/052515/what-average-profit-margin-company-banking-sector.a Efficiency and Return on Assets Ratio 0.800 0.700 60.703 0.670 0.600 0.605 Assets, Interest Income, Interest Expenses and Net Income after tax 700,000,000 600,000,000 500,000,000 400,000,000 300,000,000 200,000,000 100,000,000 2020 2019 2018 Total Assets 602,354,899 573,245,655 534,089,043 Total Interest Income 18,135,368 20,243.795 19,238,791 Total Interest Expenses 7,695,327 10,159.877 9,604,351 Net Income including Non-Controlling interest (Net Income after tax) 1,146,569 4,455,187 5,663,353 0.500 0.400 0.300 0.200 0.100 Total Assets Total Interest Income Total Interest Expenses Net Income including Non-Controlling interest (Net Income after tax) -.0 2020 9.00 0.008 2019 0.670 -Efficiency Ratio Return on Assets Ratio 0.703 0.002 0.011 2018 0.605 0.011 0.008 -Efficiency Ratio Return on Assets Ratio INCOME STATEMENT Breakdown TTM 12/30/2020 12/30/2019 12/30/2018 Total Revenue 18,133,843 16,512,31117,522,498 17,288,541 Net Interest Income 10,949,043 10.440,041 10,083.918 9,634,440 Interest Income 16,659,617 18,135,368 20,243,795 19,238,791 Interest Expense 5,710,574 7,695,327 10.159,877 9,604,351 Non Interest Income 7.184.800 6,072,270 7,438,580 7.654,101 Fees And Commissions 1,956,064 1,682,769 2,192,053 2.499,531 Fees & Commission Income 2,399,216 2,305,458 2.944,061 3,187,355 Fees & Commission Expense 443,152 622,689 752,008 687,824 Dividend Income 66,805 69,572 67.920 57,984 Income from Associates & Other Participating Interest: 102,581 116,495 30,650 34,254 Special Income Charges -467,302 -512,404 -123,767 -129,371 Impairment of Capital Assets 18,629 18,629 271,186 Write Off 405,194 515,301 123,668 49,307 Other Special Charges -1,171,718 -21,526 -271,087 80,064 Other Non Operating Income Expenses 90,798 145,515 45,130 88,298 Pretax Income 4,974,211 1,530,329 5,974,840 7,200.667 Tax Provision 1,267,465 383,760 1,519,653 1,537,314 Net Income Common Stockholders 3,655,799 1,194,424 4,559,656 5,583,510 Net Income 3,655,799 1,194,424 4,559,656 5,583,510 Net Income Including Non-Controlling Interests 3,706,746 1,146,569 4,455,187 5,663,353 Net Income Continuous Operations 3,706,746 1.146,569 4,455.187 5,663,353 Minority Interests -50.947 47.855 104,469 -79,843 Diluted NI Available to Com Stockholders 3,655,799 1,194,424 4,559,656 5,583,510 Basic EPS 0.12 0.47 0.6 Diluted EPS 0.12 0.47 0.6 Basic Average Shares 9,922,966 9,705,987 9,356,695 Diluted Average Shares 9,922,966 9,705,987 9,356,695 Net Income from Continuing & Discontinued Operation 3,655,799 1,194,424 4,559,656 5,583,510 Normalized Income 4,004,029 1,578,333 4,651,944 5,685,261 Reconciled Depreciation 1,135,589 892,524 834,263 653,145 Net Income from Continuing Operation Net Minority In 3,655,799 1,194,424 4,559,656 5,583,510 Total Unusual Items Excluding Goodwill -467,302 -512,404 -123,767 -129,371 Total Unusual Items - 467,302 -512,404 -123,767 -129,371 Tax Rate for Calcs 0 0 0 0 Tax Effect of Unusual Items -119,072 -128,495 -31,479 -27,620 COLOUR TABLE DESCRIPTIONS MAIN LEVEL VALUES FIRST LEVEL SUB-MAIN VALUES SECOND LEVEL SUB-MAIN VALUES THIRD LEVEL SUB-MAIN VALUES FOURTH LEVEL SUB-MAIN VALUES NOTES All numbers in thousands REFERENCES 1) CIMB Group Holdings Berhad Annual Report (2020, 2019, 2018) 2) Yahoo Finance (2020, 2019, 2018) retrieved from https://finance.yahoo.com/quote/1023.KL/financials?p=1023.KL BALANCE SHEET Breakdown 12/30/2020 12/30/2019 12/30/2018 Total Assets 602,354,899 573,245,655 534,089,043 Cash, Cash Equivalents & Federal Funds Sold 61,703,097 66,165.240 61,829.737 Cash And Cash Equivalents 50,953,785 54,064,259 48,041,916 Cash 10,988,914 9.815,072 11,172,227 Cash Equivalents 28,574,454 27,950.020 24,356,707 Cash And Due from Banks 7,974,153 16,299,167 12.512,982 Interest Bearing Deposits Assets 3,416,264 Restricted Cash And Investments 3,916,392 3,086,528 2.511,732 Money Market Investments 6,832,920 9,014,453 11,276,089 Federal Funds Sold & Securities Purchased Under Agreements to Resett 6,832,920 9,014,453 11,276,089 Security Agree to be Resold 6,832,920 9,014,453 11,276,089 Long Term Equity Investment 2,496,5232,427,761 1,714,366 Derivative Assets 16,014,862 11,598,325 8,664,737 Net Loan 311,285,221 313,187,859 294,448,355 Allowance for Loans And Lease Losses 11,934,932 9,159,831 9,172,365 Receivables 23,022.84325,217,83325,838,580 Prepaid Assets 91,686 Net PPE 3,035,580 3,200,777 2,348.886 Gross PPE 5.659,279 6,406,150 5,226,439 Land And Improvements 334,191 280,095 377,528 Buildings And Improvements 1,949,205 2,397,800 1,413,806 Machinery Furniture Equipment 1,072,692 1,269,196 1,275,655 Construction in Progress 2,233,798 2.387.162 2,069,243 Other Properties 69,393 71,897 90.207 Accumulated Depreciation -2,623,699 -3,205,373 -2,877,553 Goodwill And Other Intangible Assets 9,745,033 9,542,708 9,388,580 Goodwill 7,758,423 7,857,5397,680,096 Other Intangible Assets 1,986,6101,685,169 1,708,484 Assets Held for Sale 8,405 7,467 320,167 Other Assets 5,729,2995,000,550 5,384,746 Total Liabilities Net Minority Interest 545,180.777 515,776,579 481,501,072 Total Liabilities Net Minority Interest Total Deposits Derivative Product Liabilities Long Term Debt And Capital Lease Obligation Other Liabilities Total Equity Gross Minority Interest Stockholders' Equity Capital Stock Preferred Stock Common Stock Additional Paid in Capital Treasury Stock Other Equity Interest Minority Interest Total Capitalization Preferred Stock Equity Common Stock Equity Net Tangible Assets Invested Capital Tangible Book Value Total Debt Share Issued Ordinary Shares Number Preferred Shares Number Treasury Shares Number 545,180,777 515,776,579 481,501,072 442,903.869 426,125,941 399,250,071 16,340,770 11,337,869 8,407,981 42,314,018 48,857,988 39,025,465 32,077.626 17,430,708 17,577,506 57,174,122 57,469,076 52,587,971 56,125,641 56,437,171 51,574,295 25.843,808 25.843,808 24.131.750 200,000 200,000 25,843,808 25,843,808 24,131,750 24,131,750 43 43 43 199,437 199,437 199,437 1,048,481 1,031,905 1,013,676 97,896,435 104,583,971 90,599,760 200,000 200,000 56,125,641 56.437,171 51,574.295 46,380,608 46,894,463 42.185,715 97,896,435 104,583,971 90,599.760 46,380,608 46,894,463 42,185,715 42,314,018 48,857,988 39,025,465 9,922.971 9.922,971 9,564,459 9,922,966 9.922,966 9,564,455 200,000 200,000 4.908 4.908 4.908 CASH FLOW Breakdown Operating Cash Flow Investing Cash Flow Financing Cash Flow End Cash Position Changes in Cash Effect of Exchange Rate Changes Beginning Cash Position Other Cash Adjustment Outside Change in Cash Capital Expenditure Issuance of Debt Repayment of Debt Free Cash Flow TTM 12/30/2020 12/30/2019 12/30/2018 23,255,943 44,115,856 862,257 1,776,969 - 12,531,625 -28,483,764 -542,503 5,892,269 -8,325,366 -11,743,444 1,185,450 -1,827,984 44,175,766 40,337,045 37,765,092 35,528,934 2,398,952 3.888.648 | 1,505,204 -5,943,284 406,204 -459,596 730.954 -193,382 41.776.814 37.765,092 35,528.934 41,667.884 -660,487 -857,099 -2.284 -919,852 -1,129,383 -957,218 -1,051,094 8,356,343 6,752,786 11,130,015 10,110,243 -14,105,282 -15,518,776 -7,168,366 -9,767,637 22,336,091 42,986,473 -94,961 725,875 Ability to generate profit 2019 Total Assets Total Interest Income Total Interest Expenses Net Income including Non-Controlling interest (Net Income after tax Net Interest Margin Efficiency Ratio Return on Assets Ratio 2020 ######### 18,135,368 7,695,327 1,146,569 10.440,041 0.703 0.002 20,243,795 10,159,877 4,455,187 10,083,918 0.670 0.008 2018 ######### 19,238,791 9,604,351 5,663,353 9,634,440 0.605 0.011 NOTES (1) All numbers in thousands (MYR) 2) Three key metrics for investors to use when evaluating companies in the banking sector as potential investments are net interest margin, efficiency ratios, and the return on assets (ROA) ratic 3) The net interest margin is, for banks, a similar measure to gross profit margin for most companies, calculated by subtracting total interest expense from the bank's total interest income 4) Net interest margin = Total Interest Income - Total Interest Expenses 5) An efficiency ratio measures a company's ability to use its assets to generate income. 6) Efficiency ratio = Non-interest Expanses / Revenue 7) An efficiency ratio of 50% or under is considered optimal. If the efficiency ratio increases, it means a bank's expenses are increasing or its revenues are decreasing. 8) The return on assets (ROA) ratio is important to companies in the banking sector because it determines how profitable the company is relative to its total assets. 9) Retyrn on Assets ratio = Net Income including Non-Controlling interest (Net Income after tax)/Total Assets 10) Banks are highly leveraged even a seemingly low 1% or 2% ROA can still represent large revenues and profits. REFERENCES 1) CIMB Group Holdings Berhad Annual Report (2020, 2019, 2018) 2) Yahoo Finance (2020, 2019, 2018) retrieved from https://finance.yahoo.com/quote/1023.KL/financials?p=1023.KL 3) Investopedia, What Is the Average Profit Margin for a Company in the Banking Sector?, retrieved from https://www.investopedia.com/ask/answers/052515/what-average-profit-margin-company-banking-sector.a REFERENCES 1) CIMB Group Holdings Berhad Annual Report (2020, 2019, 2018) 2) Yahoo Finance (2020, 2019, 2018) retrieved from https://finance.yahoo.com/quote/1023.KL/financials?p=1023.KL 3) Investopedia, What Is the Average Profit Margin for a Company in the Banking Sector?, retrieved from https://www.investopedia.com/ask/answers/052515/what-average-profit-margin-company-banking-sector.a Efficiency and Return on Assets Ratio 0.800 0.700 60.703 0.670 0.600 0.605 Assets, Interest Income, Interest Expenses and Net Income after tax 700,000,000 600,000,000 500,000,000 400,000,000 300,000,000 200,000,000 100,000,000 2020 2019 2018 Total Assets 602,354,899 573,245,655 534,089,043 Total Interest Income 18,135,368 20,243.795 19,238,791 Total Interest Expenses 7,695,327 10,159.877 9,604,351 Net Income including Non-Controlling interest (Net Income after tax) 1,146,569 4,455,187 5,663,353 0.500 0.400 0.300 0.200 0.100 Total Assets Total Interest Income Total Interest Expenses Net Income including Non-Controlling interest (Net Income after tax) -.0 2020 9.00 0.008 2019 0.670 -Efficiency Ratio Return on Assets Ratio 0.703 0.002 0.011 2018 0.605 0.011 0.008 -Efficiency Ratio Return on Assets Ratio
Step by Step Solution
There are 3 Steps involved in it

Get step-by-step solutions from verified subject matter experts