

Question: need python code for this 2. Simple functions and plotting Write code that defines a function g(x;=0,=1.0) to compute the normal probability density function with
need python code for this
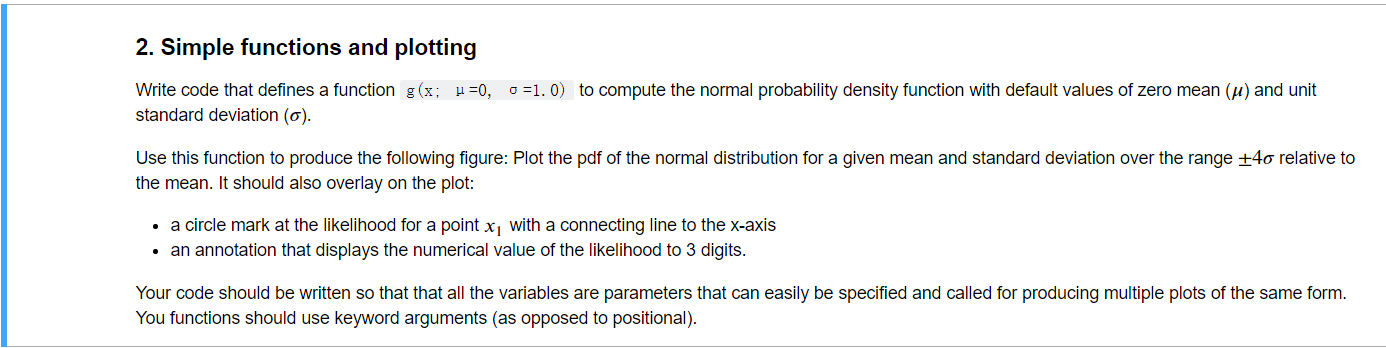
2. Simple functions and plotting Write code that defines a function g(x;=0,=1.0) to compute the normal probability density function with default values of zero mean () and unit standard deviation (). Use this function to produce the following figure: Plot the pdf of the normal distribution for a given mean and standard deviation over the range 4 relative to the mean. It should also overlay on the plot: - a circle mark at the likelihood for a point x1 with a connecting line to the x-axis - an annotation that displays the numerical value of the likelihood to 3 digits. Your code should be written so that that all the variables are parameters that can easily be specified and called for producing multiple plots of the same form. You functions should use keyword arguments (as opposed to positional)
Step by Step Solution
There are 3 Steps involved in it

Get step-by-step solutions from verified subject matter experts