

Question: Need rcode or at least part(a). Consider the trivariate random vector (Y}, Y5, Y;) with the density fly,yaus) =exexp{=(y + w2 +vs +my2 + 2vays
Need rcode or at least part(a).
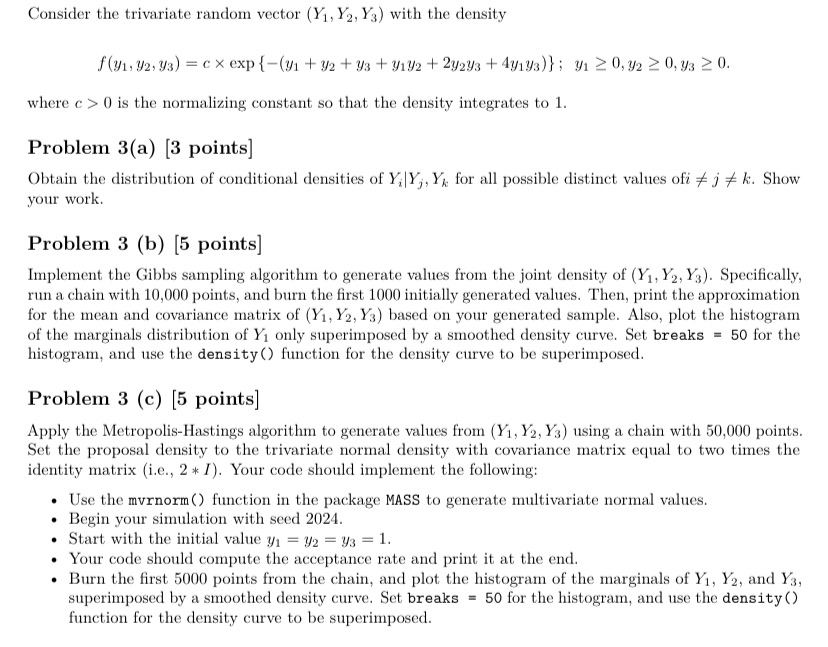
Consider the trivariate random vector (Y}, Y5, Y;) with the density fly,yaus) =exexp{=(y + w2 +vs +my2 + 2vays +dyiyz)}: 11 = 0y2 = 0,53 =0, where = 0 is the normalizing constant so that the density integrates to 1. Problem 3(a) [3 points] Obtain the distribution of conditional densities of Y;|Y;, Y}, for all possible distinet values ofi # j # k. Show vour work, Problem 3 (b) [5 points] Implement the Gibbs sampling algorithm to generate values from the joint density of (Y7, Y5, 3). Specifically, run a chain with 10,000 points, and burn the fArst 1000 initially generated values. Then, print the approximation for the mean and covariance matrix of (Y1, Y2, Y3) based on your generated sample. Also, plot the histogram of the marginals distribution of Y7 only superimposed by a smoothed density curve, Set breaks = 50 for the histogram, and use the density () function for the density curve to be superimposed. Problem 3 (c) [5 points] Apply the Metropolis-Hastings algorithm to generate values from (Y7, Y2, Y3) using a chain with 50,000 points. Set the proposal density to the trivariate normal density with covariance matrix equal to two times the identity matrix (i.e., 2+ I). Your code should implement the following: s Use the mvrnorm () function in the package MASS to generate multivariate normal values, o Begin vour simulation with seed 2024, e Start with the initial value y; = 42 = y3 = 1. Your code should compute the acceptance rate and print it at the end, Burn the first 5000 points from the chain, and plot the histogram of the marginals of Y7, Y5, and Y53, superimposed by a smoothed density curve. Set breaks = 50 for the histogram, and use the density () function for the density curve to be superimposed
Step by Step Solution
There are 3 Steps involved in it

Get step-by-step solutions from verified subject matter experts